While animal welfare governance continues to be influenced by technological advancement and automation, there is an absence of longitudinal, cross-country, quantitative index that simultaneously features the governance baseline, the direction of policy change, and the compounding risk posed by agricultural artificial intelligence (AI) adoption. This paper introduces the Animal Welfare and Policy Risk Index (AWPRI), a composite risk index covering 25 countries over the period 2004–2022 (N = 475 country-year observations). The AWPRI is constructed from 15 variables organised across three equal-weighted conceptual layers: Current Welfare State (L1), Policy Trajectory (L2), and AI Amplification Risk (L3). Variables are normalised to [0, 1] using min-max scaling, with higher values denoting greater policy risk. The index is validated through k-means cluster analysis (k = 4; silhouette coefficient = 0.447), principal component analysis (PCA) of the 15-variable cross-section, and sensitivity analysis under ±10 percentage-point layer weight perturbation (mean Spearman ρ = 0.993, minimum 0.979; mean Adjusted Rand Index (ARI) = 0.684, range 0.477–1.000). Our Hausman specification test favours random-effects (RE) panel estimation (H = 2.55, p = 0.467). We use a difference-in-differences (DiD) design to exploit the 2019 AI governance risk classification divergence and find that countries identified as high-AI-governance-risk carry AWPRI scores 0.080 points higher than their low-risk counterparts, after controlling for country and year fixed effects (β = 0.080, SE = 0.005, p < 0.001). The L3 layer records the highest mean score in the 2022 cross-section (0.552, SD = 0.175), significantly exceeding both L1 (Wilcoxon W = 102,651, p < 0.001) and L2 (W = 99,295, p < 0.001). China (0.802), Vietnam (0.612), and Thailand (0.586) record the highest composite risk scores in 2022; the United Kingdom (0.308) the lowest. AutoRegressive Integrated Moving Average (ARIMA)-based projections indicate that Thailand, Brazil, and Argentina face AWPRI risk deterioration by 2030. The AWPRI and its interactive visualisation are publicly accessible at https://awpri-dashboard.streamlit.app.
Approximately 80 billion land animals are slaughtered annually within global food systems [1]. The scale of this figure renders the institutional underinvestment in animal welfare governance both empirically significant and policy-relevant. Comparative political science and public policy scholarship have been slow to develop quantitative frameworks for cross-country welfare governance assessment. Where animal welfare is scholarly discussed, analysis is predominantly shaped by normative or legal terms [2, 3], or confined to case studies of discrete regulatory regimes [4]. There is an absence of a longitudinal, cross-country, quantitative instrument that tracks how animal welfare governance performs over time, whether those trajectories are improving or deteriorating, and whether emerging technological forces compound pre-existing governance gaps.
The rapid commercialisation of artificial intelligence (AI) in livestock production makes the discussion of technologically facilitated animal welfare regulation increasingly timely and relevant. Computer vision systems for automated lameness detection, AI-driven feed optimisation, and predictive disease modelling are now commercially deployed across major livestock-producing economies [7, 8]. Market projections for the precision livestock farming (PLF) sector reach USD 19.87 billion by 2032 [9]. A body of literature argues that AI enables earlier detection of welfare problems and reduces reliance on invasive interventions [10, 11]. Additional literature raises substantive concerns that PLF’s welfare-positive claims remain unproven at commercial scale, and that AI-driven intensification poses systemic threats to welfare in jurisdictions whose regulatory frameworks were not designed to address algorithmic accountability [12, 13].
Existing composite measures of animal welfare governance, including the World Animal Protection’s Animal Protection Index [5] and Hårstad’s scoping review [3], feature legislative text at a single point in time. Neither instrument tracks law enforcement dynamics, policy reform trajectories, or the compounding effect of technological adoption on governance gaps. This paper addresses these limitations through the introduction and analysis of the Animal Welfare and Policy Risk Index (AWPRI).
1.1 Research Questions and Contributions
This paper pursues three research questions. First, how can animal welfare policy risk be operationalised as a measurable, cross-country comparable composite index sensitive to the governance implications of AI adoption in agriculture? Second, what patterns of risk distribution, clustering, and temporal change emerge across 25 countries between 2004 and 2022? Third, how does AI adoption in agriculture interact with pre-existing governance conditions and trajectories, and what national risk profiles are projected to emerge by 2030?
The paper makes four contributions.
It introduces the AWPRI: the first longitudinal, cross-country, AI-sensitive composite risk index for animal welfare governance, covering 25 countries over 19 years.
It validates the index through k-means cluster analysis, principal component analysis (PCA), Hausman specification testing, and a sensitivity analysis under layer weight perturbation.
It employs a difference-in-differences (DiD) design to estimate the effect of AI governance risk classification divergence on AWPRI trajectories, providing the first quasi-experimental evidence linking AI governance status to animal welfare policy risk.
It presents AutoRegressive Integrated Moving Average (ARIMA)-based projections to 2030 for all 25 countries with 95% confidence intervals, identifying which national risk profiles are projected to deteriorate absent policy intervention.
2. Related Work
2.1 Animal Welfare Governance and Composite Indices
Composite indices are well-established instruments for cross-country governance comparison. The Human Development Index [15], the Environmental Performance Index [16], and the Global Peace Index [17] demonstrate that multidimensional governance circumstances can be reduced to measurable scores while retaining policy interpretability. In the animal welfare domain, Browning [18] argues explicitly that multidimensional welfare measurement frameworks can support policy analysis. However, to date, no composite index applies such a framework to the intersection of animal welfare governance and AI adoption.
The World Animal Protection’s Animal Protection Index [5] rates 50 countries on legislative capacity at a single point in time. Hårstad’s scoping review of farm animal welfare governance [3] similarly prioritises legislative text and political drivers. He finds that policy change is neither linear nor easily predictable. Neither instrument takes into account the enforcement dynamics, temporal trajectories, or the risk introduced by AI-driven agricultural intensification. The Animal Law Foundation [6] has documented that fewer than 2.5% of farms in England were inspected in 2024, with 19% of inspected farms found in breach of welfare laws and fewer than 1% of violations resulting in prosecution. This enforcement gap illustrates the dimension that static legislative indices fail to highlight.
2.2 AI and PLF
Tuyttens et al. [12] identify 12 welfare threats specific to PLF adoption, including the displacement of human observation by algorithms, the intensification of stock enabled by automated monitoring, and the commercial incentives to use AI for productivity maximisation over welfare improvement. These concerns are amplified in jurisdictions with weak baseline welfare legislation, in which AI adoption can accelerate production intensification without triggering comparable regulatory responses [14]. Elliott and Werkheiser [13] argue that existing PLF transparency frameworks remain conceptually underdeveloped, and that most AI agricultural systems operate without welfare-specific accountability mechanisms. The AWPRI’s L3 layer is designed specifically to quantify the compounding risk associated with this governance-technology asymmetry.
2.3 Panel Data Approaches to Governance Measurement
Fixed-effects (FE) and random-effects (RE) panel regression are standard approaches to exploiting longitudinal cross-country differences in governance indices. Hausman [19] specification tests are the conventional criterion for model selection. A significant Hausman statistic indicates that country-specific effects are correlated with the regressors, favouring the FE estimator, while a non-significant outcome renders the RE estimator valid and more efficient. DiD designs have been applied to identify causal effects of policy interventions in governance research [20]. Our statistical analysis provides the first quasi-experimental evidence in the animal welfare governance literature.
3. Methods
3.1 Country and Time Period
The AWPRI panel dataset covers 25 countries across six global regions over 19 years (2004–2022), resulting in a total of (25×19=) 475 country-year observations. Countries were selected to maximise regional diversity, data availability, and change in welfare legislative capacity, incorporating the world’s largest livestock producers, the most progressive welfare legislatures, and major emerging economies undergoing rapid agricultural AI adoption. The 25 countries featured in this study are: Argentina, Australia, Brazil, Canada, China, Denmark, France, Germany, India, Italy, Japan, Kenya, Mexico, the Netherlands, New Zealand, Nigeria, Poland, South Africa, South Korea, Spain, Sweden, Thailand, the United Kingdom, the United States, and Vietnam. The full dataset is accessible at https://awpri-dashboard.streamlit.app. All analyses reported in this paper use the panel_awpri_normalized.csv dataset, which is the identical source used for data visualisation in the AWPRI interactive dashboard.
3.2 Variable Selection and Operationalisation
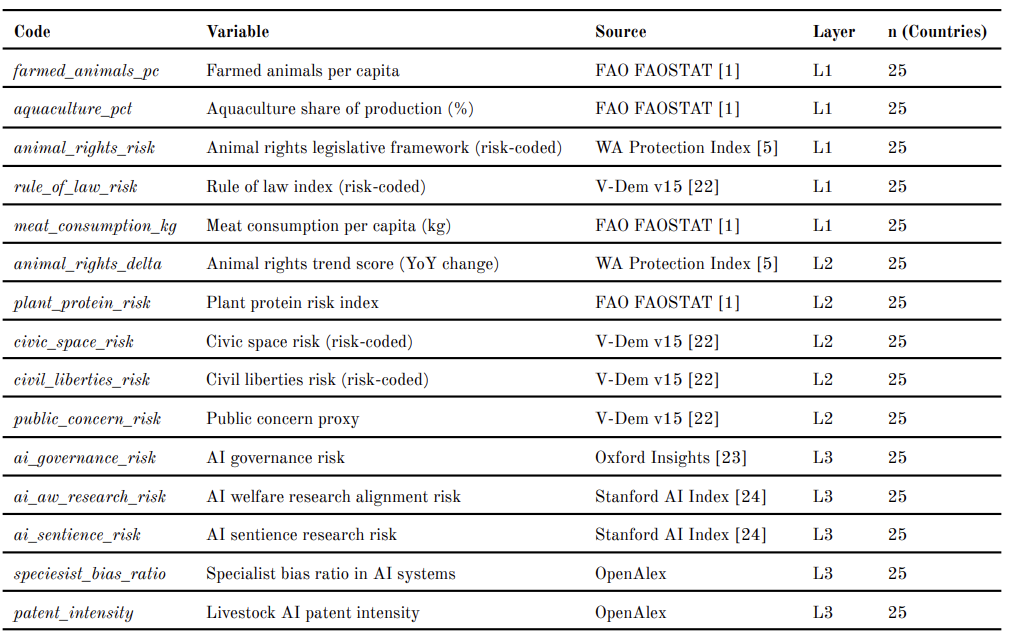
Fifteen variables are assigned across three equal-weighted conceptual layers, with five variables per layer. Layer 1 (L1: Current Welfare State) measures the governance baseline: (1) animal rights legislative framework; (2) rule of law index (risk-coded); (3) farmed animals per capita; (4) aquaculture share of production; and (5) meat consumption per capita. Layer 2 (L2: Policy Trajectory) features the direction and pace of governance change: (6) animal rights trend score (year-on-year legislative change); (7) plant protein risk; (8) civic space risk; (9) civil liberties risk; and (10) public concern proxy. Layer 3 (L3: AI Amplification Risk) quantifies the compounding effect of AI adoption in agriculture: (11) AI governance risk; (12) AI welfare research alignment; (13) AI sentience research risk; (14) specialist bias ratio in AI systems; and (15) livestock AI patent intensity. All 15 variables are coded such that higher values represent greater policy risk. Data are drawn from the World Animal Protection’s Animal Protection Index [5], FAO FAOSTAT [1], the V-Dem Democracy Index [22], the Oxford Insights Government AI Readiness Index [23], the Stanford AI Index [24], and patent databases via OpenAlex. Missing values (approximately 7.3% of observations) are imputed using linear interpolation within country time series.
3.3 AWPRI Construction
All 15 variables are normalised to [0, 1] using min-max normalisation across the full 2004–2022 panel, enabling valid cross-country and cross-temporal comparison. Each layer score is the unweighted mean of its five constituent variables:
L₁it = (1/5) ∑{k ∈ 𝒦₁} vkit
L₂it = (1/5) ∑{k ∈ 𝒦₂} vkit
L₃it = (1/5) ∑{k ∈ 𝒦₃} vkit
where 𝒦₁, 𝒦₂, 𝒦₃ denote the five-variable indicator sets for Layer 1, Layer 2, and Layer 3, respectively, as defined in Table A1 (Appendix), and where vkit denotes the normalised value of variable k for country i in year t.
The composite AWPRI score is the unweighted mean of the three layer scores:
AWPRIit = (L₁it + L₂it + L₃it / 3
Equal weighting is applied following Organisation for Economic Co-operation and Development (OECD) and Joint Research Centre (JRC) recommendations for composite indicators when no strong prior evidence exists for differential weighting across dimensions [21]. The robustness of this decision is evaluated through a sensitivity analysis described in Section 3.7.
3.4 Cluster Analysis and Validation
A four-tier risk typology is defined using score-based thresholds: Critical (≥ 0.55), High (0.45–0.55), Moderate (0.35–0.45), and Low (< 0.35). These boundaries are validated using k-means cluster analysis on the 2022 cross-section of composite and layer scores, with the optimal k determined through the elbow method and silhouette coefficient analysis. Cluster robustness is evaluated using three complementary metrics, namely (1) the silhouette coefficient, (2) the Calinski–Harabasz index, and (3) the Davies–Bouldin index.
3.5 Forecasting
Country-level AWPRI trajectories are projected to 2030 using ARIMA models estimated separately for each country, with model order selection via Akaike Information Criterion (AIC) minimisation. Forecast uncertainty is represented by 95% confidence intervals. All models are implemented in Python using the statsmodels library.
3.6 Statistical Analysis
A total of seven complementary inferential analyses are conducted.
First, Wilcoxon signed-rank tests are used to evaluate whether L3 scores are systematically higher than L1 and L2, both across the full panel (N = 475) and in the 2022 cross-section (n = 25). The signed-rank test is preferred over the parametric t-test given the bounded, non-normal distribution of normalised layer scores.
Second, a Spearman rank correlation matrix is computed for the 15 constituent variables on the 2022 cross-section to assess construct validity and detect potential multicollinearity in the index structure.
Third, a Kruskal–Wallis test followed by pairwise Mann–Whitney U tests with Bonferroni correction are applied to test whether AWPRI scores differ significantly across risk tiers.
Fourth, a Hausman specification test is conducted to choose between FE and RE panel estimators.
where βFE and β̂RE denote FE and RE coefficient vectors, respectively, and K is the number of time-varying regressors. A significant statistic (p < 0.05) implies a systematic difference between the estimators, favouring FE.
Fifth, a DiD design exploits the divergence in country-level AI governance risk classification that emerged from the 2019 Oxford Insights Government AI Readiness Index. Countries are classified as treated (ai_governance_risk = 1.0 in 2019, n = 14) and control (ai_governance_risk = 0.0, n = 11). The pre-period covers 2004–2016; the post-period refers to 2019–2022, omitting the 2017–2018 transition years. The estimating equation is:
AWPRIit = α + β(Postt × Treati) + γi + δt + εit
where Postt is an indicator for the post-treatment period, Treatiis the treatment indicator, γi and δt denote country and year fixed effects, respectively, and β is the DiD estimator of the average treatment effect on the treated (ATT). Standard errors are clustered by country. The parallel pre-trends assumption is tested through an interaction of year trend with treatment indicator in the pre-period.
Sixth, a sensitivity analysis evaluates the AWPRI score ranking stability under ±10 percentage-point layer weight perturbation. For each perturbed weight combination, the Spearman rank correlation with the base AWPRI ranking and the Adjusted Rand Index (ARI) for cluster assignment stability are computed.
Seventh, a PCA of the standardised 15-variable cross-section is conducted to identify the latent dimensional structure of the index and determine whether governance gaps are domain-general or thematically structured.
3.7 Sensitivity Analysis
The robustness of the equal-weighting scheme is assessed through a systematic perturbation analysis. Layer weights are varied by ±10 percentage points from the baseline equal allocation (w₁ = w₂ = w₃ = 1/3), subject to the constraint that all weights remain strictly positive and sum to unity. All feasible weight combinations within this tolerance are enumerated at five percentage-point intervals, creating a set of alternative composite specifications. For each alternative specification, two robustness criteria are evaluated, namely (1) the Spearman rank correlation between the perturbed AWPRI ranking and the baseline ranking, and (2) the ARI between the cluster assignments derived from the perturbed scores and those derived from the baseline scores. The Spearman criterion tests whether country rank orderings are stable under plausible reweighting; the ARI criterion tests whether countries would be assigned to different risk tiers under alternative weighting assumptions. A mean Spearman ρ above 0.95 is adopted as the primary threshold for acceptable rank-ordering robustness; the ARI is reported as a supplementary indicator of cluster assignment stability, following conventions for composite indicator stability assessment [21].
4. Results
4.1 Descriptive Statistics
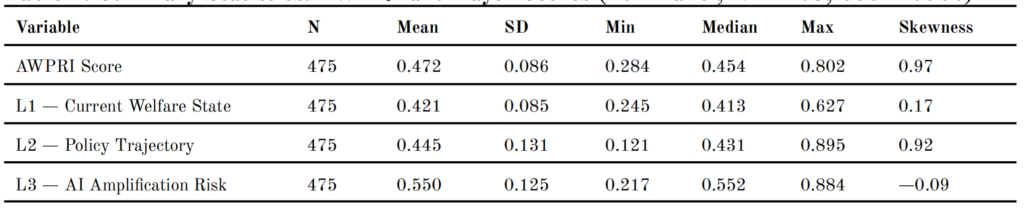
Table 1 presents summary statistics for the AWPRI composite score and its three constituent layer scores across the full panel (N = 475). The AWPRI has a full-panel mean of 0.472 (SD = 0.086) and is positively skewed (skewness = 0.97). The skewness value suggests a concentration of critical-risk countries at the upper tail of the distribution. L3 records the highest full-panel mean (0.550, SD = 0.125) and L1 the lowest (0.421, SD = 0.085). The narrow within-country standard deviation of L1 (0.008) relative to L2 (0.073) and L3 (0.051) indicates the structural stability of animal welfare legislation relative to the more volatile policy trajectory and AI governance components between 2004 and 2022.
Table 1. Summary Statistics: AWPRI and Layer Scores (Full Panel, N = 475, 2004–2022)
In the 2022 cross-section (n = 25), the sample mean AWPRI is 0.461 (SD = 0.111). L3 records the highest mean at 0.552 (SD = 0.175), exceeding L2 (mean = 0.410, SD = 0.138) and L1 (mean = 0.422, SD = 0.094). The maximum L3 score is recorded by China (0.884); the minimum by the United States (0.218). Wilcoxon signed-rank tests show that L3 scores are significantly higher than both L1 (W = 102,651, p < 0.001) and L2 (W = 99,295, p < 0.001) across the full panel. In the 2022 cross-section, L3 exceeds L1 (W = 271, p = 0.001) and L2 (W = 302, p < 0.001). These statistical outputs align with one another regardless of whether the full panel or the 2022 cross-section is employed.
Figure 1: AWPRI Rankings by Country, 2022. Countries ordered by AWPRI score (ascending). Dashed line = sample mean (0.461). Shading indicates risk tier.
4.2 Spearman Correlation Structure
Figure 2 presents selected pairwise Spearman rank correlations among the 15 constituent variables in the 2022 cross-section. We see several high correlations in Figure 2, most notably between ai_aw_research_risk and ai_sentience_risk (ρ = 0.97), and between rule_of_law_risk and civil_liberties_risk (ρ = 0.93). These high within-layer correlations indicate theoretically coherent constructs (i.e., (1) governance quality indicators and (2) AI knowledge indicators, respectively). These two near-redundant pairs (meaning (1) ai_aw_research_risk and ai_sentience_risk (ρ = 0.97) and (2) rule_of_law_risk and civil_liberties_risk (ρ = 0.93)) are retained on theoretical grounds. Here, ai_aw_research_risk measures the degree to which AI welfare research aligns with commercial incentives, whereas ai_sentience_risk features researcher scepticism about AI moral consideration, representing distinct mechanisms. Also, rule_of_law_risk shows formal institutional constraints on arbitrary state action, whereas civil_liberties_risk features the practical exercise of individual freedoms, representing separable dimensions of the governance environment. We can see that the cross-layer correlation structure is modestly lower, with a maximum cross-layer pair of meat_consumption_kg and plant_protein_risk (ρ = 0.80). Figure 2 presents the full 15 × 15 Spearman correlation heatmap.
Figure 2: Spearman Rank Correlation Matrix, 15 Constituent Variables, 2022 Cross-Section. Bold horizontal and vertical lines delineate L1, L2, and L3 boundaries. Values displayed where |ρ| > 0.40.
4.3 Cross-Country AWPRI Scores, 2022
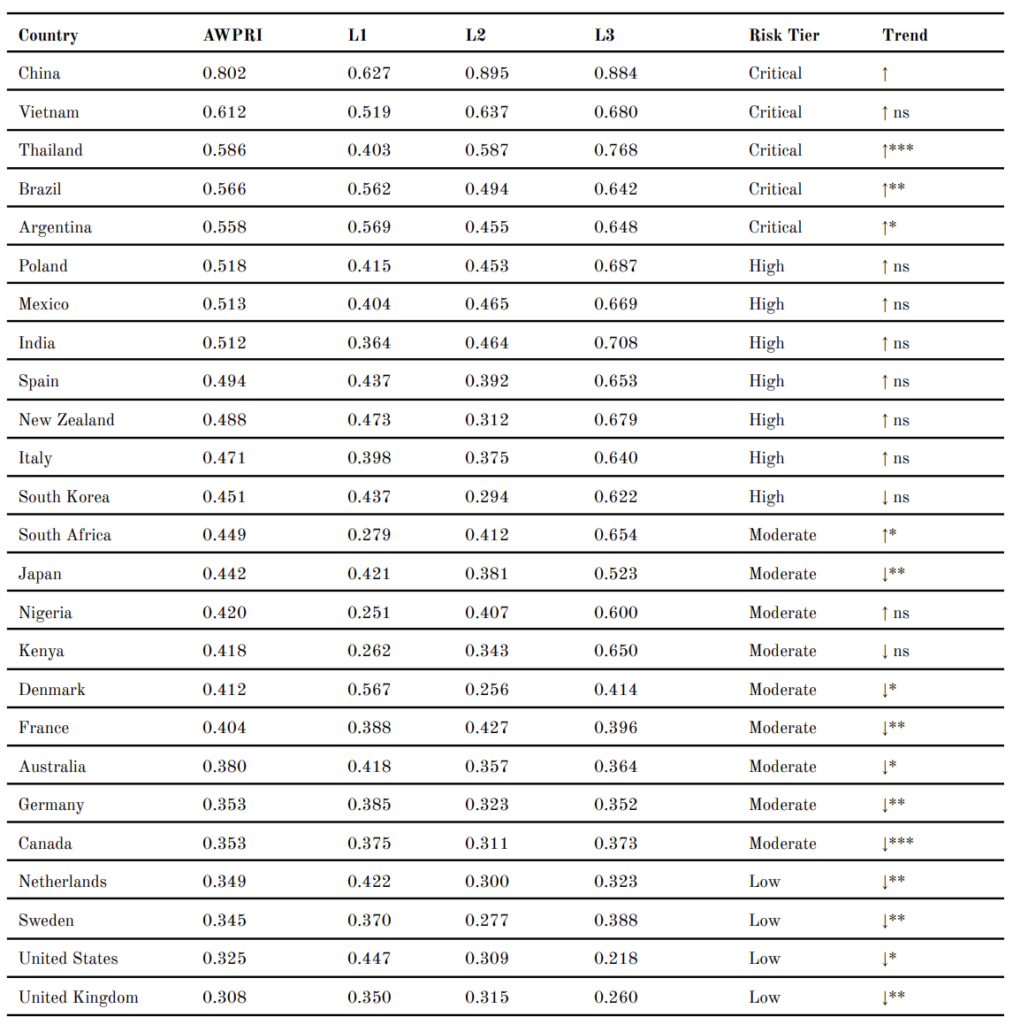
Table 2 presents the AWPRI composite scores and layer decompositions for all 25 countries as of 2022. In 2022, China recorded the highest AWPRI score (0.802), driven by the highest L2 score in the sample (0.895). This indicates a deteriorating animal welfare legislation reform trajectory (as shown by its L2 score) against a concerning governance baseline (as shown by its L1 score). Vietnam (0.612) and Thailand (0.586) record the second and third highest composite scores, with Vietnam recording an L3 score of 0.680 and Thailand 0.768, both substantially above the sample mean (0.552). At the lower end, the United Kingdom records the lowest AWPRI score (0.308), followed by the United States (0.325) and Sweden (0.345).
Figure 3 presents the layer score decomposition across all 25 countries. A notable pattern is that L3 scores usually exceed the L1 and L2 counterparts for the majority of the sample, including countries with comparatively strong governance baselines such as Germany (L3 = 0.352), Sweden (L3 = 0.388), and the United Kingdom (L3 = 0.260). These findings preliminarily suggest that stronger animal welfare legislation and favourable policy trajectories do not systematically lower AI amplification risk, a finding that is tested in Section 4.5.
Figure 3: Layer Score Decomposition by Country, 2022. Countries ordered by AWPRI score (descending). Dashed horizontal lines indicate sample means for each layer.
Table 2. AWPRI Scores and Layer Decomposition by Country, 2022
Note. Trend column reports direction and significance of Ordinary Least Squares (OLS) trend slope (AWPRI ~ year, 2004–2022). * p < 0.05; ** p < 0.01; *** p < 0.001; ns = non-significant.
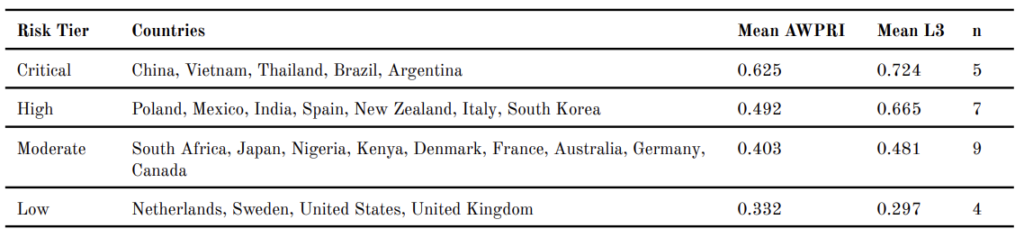
4.4 Risk Cluster Typology and Validation
Table 3 presents the risk cluster typology we designed from threshold-based score classification. The Critical Risk tier (n = 5) comprises China, Vietnam, Thailand, Brazil, and Argentina. All three layer scores of these five countries approach or exceed the sample means (L1 ≥ 0.422; L2 ≥ 0.410; L3 ≥ 0.552), except Thailand’s L1 score (0.403), which falls marginally below the L1 mean, indicating that (1) weak legislative frameworks, (2) deteriorating reform trajectories, and (3) rapid AI adoption are compounding altogether. The High Risk tier (n = 7) is dominated by L3 as the primary contributor, with member countries exhibiting identifiable legislative frameworks and moderate reform activity but an AI adoption trajectory that outpaces regulatory capacity. The Moderate Risk tier (n = 9) shows unevenly distributed risks across layers, with L1 recording relatively higher scores than L2 or L3, suggesting that the primary concern is not the absence of legislation but its reform pace and emerging AI governance gaps. The Low Risk tier (n = 4) comprises the Netherlands, Sweden, the United States, and the United Kingdom, which record the strongest governance baselines and the lowest L3 scores in the sample.
Figure 4 presents the cluster validation results. The elbow method applied to within-cluster sum of squares identifies k = 4 as the point of diminishing returns beyond which additional clusters produce marginal improvements. The silhouette coefficient for k = 4 is 0.447 (Calinski–Harabasz index = 35.56; Davies–Bouldin index = 0.659), indicating an adequate to good cluster solution. Notably, k = 3 results in a marginally higher silhouette coefficient (0.492), showing the empirical clustering of China as a singleton at k = 4. This finding is meaningful, as k-means identifies China as an outlier of sufficient magnitude to justify its own cluster when the algorithm is unconstrained. The four-tier typology is kept on theoretical grounds, as the threshold boundaries carry informative policy-interpretive value.
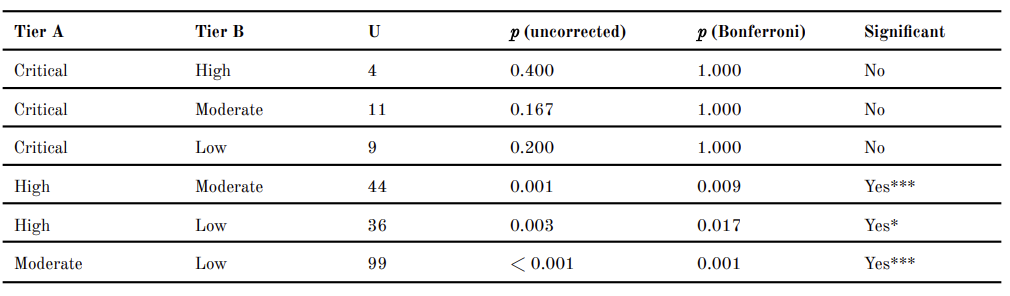
A Kruskal–Wallis test shows that AWPRI scores differ significantly across the four risk tiers (H = 20.77, p < 0.001). Pairwise Mann–Whitney U tests with Bonferroni correction reveal that all adjacent tier comparisons are statistically significant (e.g., High vs Moderate (p = 0.009), High vs Low (p = 0.017), and Moderate vs Low (p = 0.001)). Income group comparisons show that AWPRI scores differ significantly by World Bank classification in 2022 (Kruskal–Wallis H = 12.130, p = 0.002), driven primarily by higher L2 (H = 14.602, p = 0.001) and L3 (H = 9.74, p = 0.008) scores among upper-middle and lower-middle income countries relative to high-income countries.
Figure 4: Cluster Validation. (A) Elbow plot of within-cluster sum of squares by k. (B) Silhouette coefficient by k. Dashed vertical line at k = 4 indicates the selected solution.
4.5 Temporal Dynamics, 2004–2022
Figure 5 illustrates AWPRI temporal trajectories for selected countries. The Trend column in Table 2 reports OLS trend slope directions and significance levels for all 25 countries. Fifteen of 25 countries display statistically significant trends over the 2004–2022 period (p < 0.05), with five worsening and ten improving. Among worsening trajectories, Thailand records the steepest slope (β = 0.005 per year, p < 0.001), followed by Brazil (β = 0.0035, p = 0.003) and South Africa (β = 0.003, p = 0.010). Among improving trajectories, Canada records the steepest improvement (β =− 0.005 per year, p < 0.001), followed by the Netherlands (β =− 0.004, p = 0.002). The full-panel mean AWPRI declines from 0.490 in 2004 to 0.461 in 2022, a net improvement driven primarily by the Moderate and Low Risk clusters. The Critical Risk cluster, however, registers a net worsening from 2004 to 2022.
Figure 5: AWPRI Temporal Trajectories, 2004–2022. (A) Critical Risk countries. (B) Low and selected Moderate Risk countries. Dashed vertical line at 2017 indicates the onset of AI governance risk differentiation.
Figure 6 presents OLS trend slope coefficients for all 25 countries with 95% confidence intervals. Countries with statistically significant worsening trajectories (positive slope, p < 0.05) are concentrated in the Critical Risk tier, while statistically significant improving trajectories (negative slope, p < 0.05) predominate in the Low and Moderate Risk clusters. The AWPRI framework predicts that countries already exposed to high baseline animal welfare risk are also experiencing the most rapid deterioration in policy conditions, which aligns with Figure 6 findings, where the concentration of worsening trajectories is in the Critical Risk tier.
Figure 6: OLS Trend Slope Coefficients by Country, 2004–2022. Bars indicate β coefficients from country-level OLS regressions of AWPRI on year. Error bars indicate 95% confidence intervals. Bars shaded by risk tier. Countries ordered by slope magnitude. * p < 0.05; ** p < 0.01; *** p < 0.001.
4.6 DiD Analysis
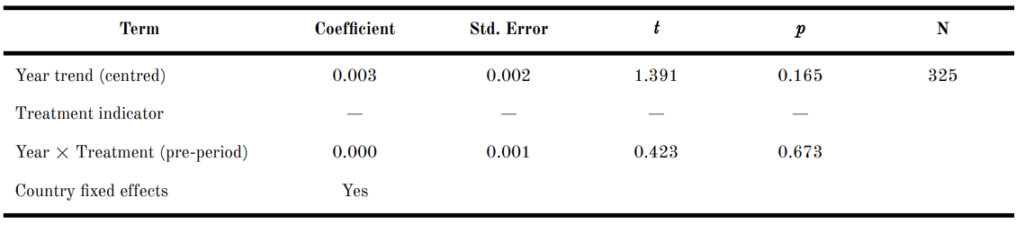
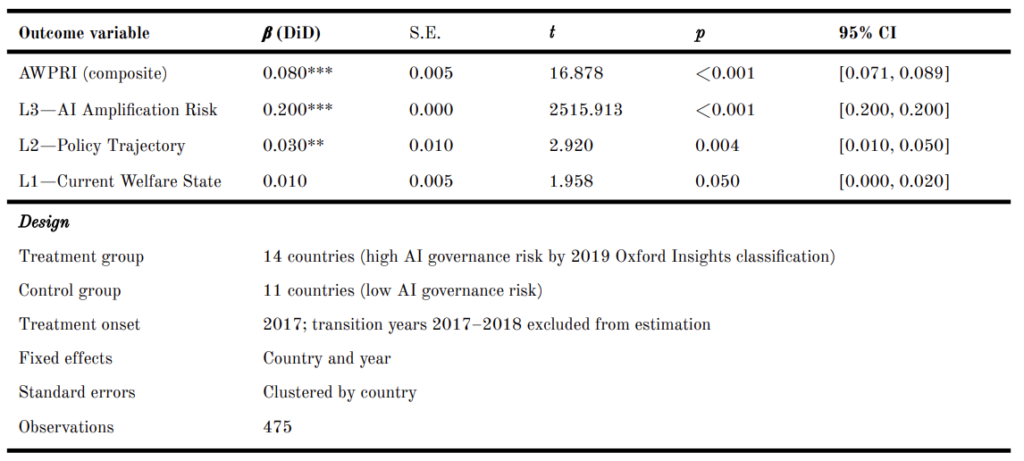
Figure 7 presents the DiD analysis. The treatment group comprises 14 countries classified as high AI governance risk by the 2019 Oxford Insights assessment (Argentina, Brazil, China, India, Italy, Kenya, Mexico, New Zealand, Nigeria, Poland, South Africa, Spain, Thailand, Vietnam); the control group comprises 11 countries with low AI governance risk (Australia, Canada, Denmark, France, Germany, Japan, the Netherlands, South Korea, Sweden, the United Kingdom, the United States). Table 4 shows the pre-treatment trend test results. We can see that the interaction between year trend and treatment indicator in the pre-period is statistically non-significant (β = 0.000, p = 0.673). This means we are not statistically confident to claim that treated and control countries followed distinguishable AWPRI trajectories prior to 2017.
The DiD estimator indicates that treated countries carry AWPRI scores 0.080 points higher than control countries in the post-treatment period (Table 5), after controlling for country and year fixed effects (β = 0.080, p < 0.001). The raw ATT is 0.080, in which the treated group’s AWPRI increased by 0.030 (from 0.506 to 0.536) while the control group’s AWPRI decreased by 0.050 (from 0.433 to 0.383) over the same period. When the DiD is estimated with L3 as the outcome, the coefficient rises to 0.200 (p < 0.001) (Table 5). This finding suggests that the divergence primarily occurs through the AI Amplification layer (i.e., L3), rather than through the governance baseline (i.e., L1) or policy trajectory (i.e., L2) components.
It is noteworthy that the treatment variable (ai_governance_risk) is one of five constituent variables within L3, which itself constitutes one third of the AWPRI composite outcome. This composition structure introduces partial endogeneity. The DiD analysis, more importantly, demonstrates that the 2019 AI governance risk classification predicts AWPRI trajectories beyond the L3 component (including the L1 governance baseline and L2 policy trajectory).
Figure 7: DiD. (A) Parallel pre-trends for treated and control groups. Dashed vertical line at 2017 indicates treatment onset; grey band indicates 2017–2018 transition years excluded from estimation. (B) Pre- and post-treatment mean AWPRI scores by group. DiD β = 0.080 (p < 0.001).
Table 4. Pre-Treatment Trend Test: OLS Regression of AWPRI on Year × Treatment Interaction, Pre-Period (2004–2016)
Note. Dependent variable: AWPRI composite score. Pre-period defined as 2004–2016 (years prior to treatment onset). Treatment group (n = 14): countries classified as high AI governance risk by the 2019 Oxford Insights assessment. Control group (n = 11): countries classified as low AI governance risk. Year trend is mean-centred. Treatment indicator is absorbed by country fixed effects and, therefore, not separately estimated. The non-significant Year × Treatment coefficient (p = 0.673) indicates that treated and control countries followed statistically indistinguishable AWPRI trajectories in the pre-period, supporting the validity of the DiD design. Standard errors are heteroskedasticity-robust.
Table 5. DiD Estimates by Outcome Variable (Treatment: High AI Governance Risk, 2019; N = 475)
Note.β (DiD) is the coefficient on the interaction term (post × treated) from OLS with country and year fixed effects. The L3 standard error is near zero because ai_governance_risk (the treatment variable) is one of five constituent variables of L3, introducing mechanical overlap; the L3 result should be interpreted with this caveat in mind. The L1 result exactly meets but does not fall below the conventional α = 0.05 threshold and should be interpreted carefully. ** p < 0.01; *** p < 0.001.
4.7 PCA
Figure 8(A) presents the scree plot. The Hausman specification test shows that H = 2.55 (p = 0.467). This means we are not statistically confident to reject the null hypothesis of no systematic difference between FE and RE estimators, indicating that the latter is valid and more efficient for descriptive panel modelling of AWPRI trajectories. PC1 accounts for 51.6% of total variance and PC2 for 17.8%; five components are required to reach 91.4% cumulative variance, as indicated by the dotted horizontal line. The findings show that the 15 indicators are not reducible to a single dimension. Figure 8(B) presents the PC1–PC2 biplot. The loading arrows indicate that the top-loading variables on PC2 point in a broadly similar direction, while country scores show no clean separation by risk tier along either y- or x-axis. Critical Risk countries (meaning those darkest markers) are concentrated in the positive region of PC1, while Low Risk countries cluster in the negative region. However, the separation is not clean across all tiers. There are several Moderate and High Risk countries overlap substantially along PC1, indicating that the first principal component alone does not reliably discriminate between risk tiers. Our three-layer composition of the AWPRI is therefore not redundant with a single principal component. Such a finding supports the need to keep our composite structure instead of collapsing to a single index dimension.
Figure 8: PCA, 15-Variable Cross-Section, 2022. (A) Scree plot. Dashed line at 90% cumulative variance. (B) PC1–PC2 biplot. Arrows indicate the top-loading variables; country scores shaded by risk tier.
4.8 Sensitivity Analysis
Figure 9 presents the sensitivity analysis under ±10 percentage-point layer weight perturbation. Figure 9(A) shows that the mean Spearman rank correlation between the perturbed and base AWPRI rankings is 0.993 (minimum: 0.979), indicating that country rank orderings are highly stable across alternative weighting schemes. Figure 9(B) shows that the ARI for cluster assignment stability ranges from 0.477 to 1.000, with a mean of 0.684. While rank orderings are robust, cluster assignments are more sensitive to weight perturbation. Under certain weight combinations, some countries cross risk tier boundaries. These findings indicate that AWPRI country rankings are robust to plausible alternative weighting schemes, but we should be aware of the fact that risk tier assignments are sensitive to the relative weight assigned to each layer.
Figure 9: Sensitivity Analysis under ±10 Percentage-Point Layer Weight Perturbation. (A) Distribution of Spearman ρ between perturbed and base AWPRI ranking. (B) Distribution of ARI for cluster assignment stability.
4.9 ARIMA Projections to 2030
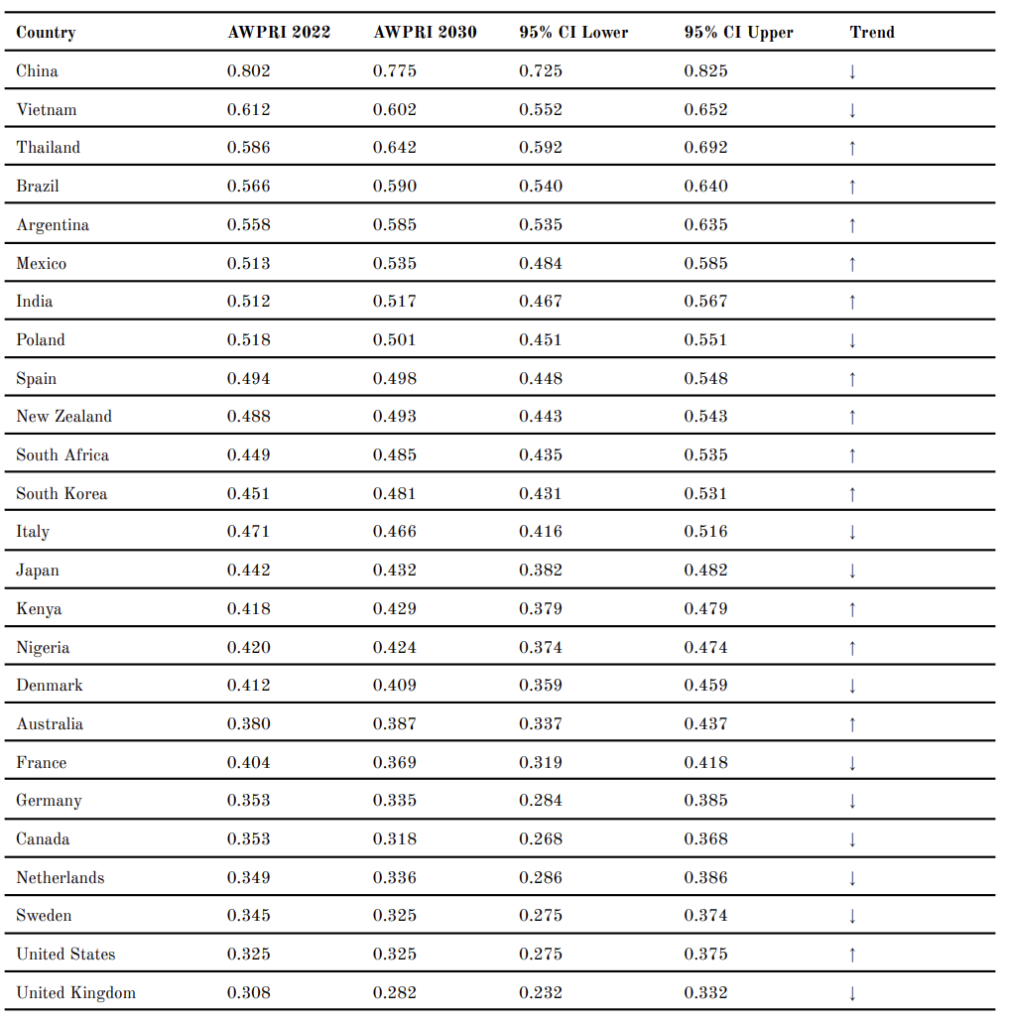
Figure 10 presents ARIMA-based AWPRI projections to 2030. Table 6 reports point forecasts and 95% confidence intervals for all 25 countries. Within the Critical Risk cluster, China (0.775) and Vietnam (0.602) are projected to improve by 2030, while Thailand (0.642), Brazil (0.590), and Argentina (0.585) are projected to deteriorate further. Within the High Risk cluster, Mexico (0.535), India (0.517), Spain (0.498), New Zealand (0.493), South Africa (0.485), and South Korea (0.481) are all projected to worsen, while Poland (0.501) and Italy (0.466) are projected to improve marginally. Among Moderate and Low Risk countries, the majority are projected to improve, with the notable exceptions of Kenya (0.429), Nigeria (0.424), Australia (0.387), and the United States (0.325), which are projected to worsen. France (0.369) and Canada (0.318) record the largest absolute improvements among all countries from 2022 (measured) to 2030 (projected), each declining by 0.035 points during the course.
Figure 10: ARIMA-Based AWPRI Projections to 2030, All 25 Countries. Lines indicate mean forecasts from 2023; shading indicates 95% confidence intervals. Trajectory colours indicate 2022 risk tier. Dashed vertical line at 2022 marks the projection onset.
Table 6. ARIMA-Based AWPRI Projections to 2030 (95% Confidence Intervals)
Note.↑ = projected worsening; ↓ = projected improvement. Forecasts derived from country-level ARIMA models with AIC-based order selection.
5. Discussion
5.1 AI Amplification as the Dominant Risk Driver
Across analyses, we find that L3 scores are systematically and significantly higher than both L1 and L2 across the full panel and in the 2022 cross-section. Countries such as India (L3 = 0.708), New Zealand (L3 = 0.679), and Poland (L3 = 0.687) record L3 scores substantially above their L1 and L2 counterparts, supporting the theoretical argument that PLF deployment accelerates agricultural intensification and displaces direct human oversight with algorithmic monitoring in jurisdictions whose governance frameworks were not designed for AI accountability [12].
Also, our finding that no country in the sample records an L3 score below 0.217 (United States) is notable. Even the United Kingdom, which records the lowest composite AWPRI and the strongest overall governance baseline in the sample, records an L3 score of 0.260. This finding indicates that even countries with mature animal welfare legislative frameworks and comparatively strong enforcement capacity face non-trivial AI amplification risks, aligning with the argument that most AI agricultural systems run without welfare-specific accountability mechanisms irrespective of jurisdictional governance quality [13].
Our DiD analysis, furthermore, provides quasi-experimental reinforcement for this interpretation. The divergence in AI governance risk classification in 2019 is associated with an AWPRI gap of 0.080 points between treated and control countries, with a significantly larger effect of 0.200 on the L3 component specifically. This pattern indicates that the institutional gaps in AI governance featured in the L3 layer are correlated with overall governance quality, in addition to representing a distinct and independent animal welfare risk pathway.
5.2 Differences in Geographic Patterns and Income Groups
The geographic distribution of risk is associated with income classification. Upper-middle income countries record a mean AWPRI of 0.583 in 2022, significantly higher than high-income countries (0.406; Kruskal–Wallis H = 12.130, p = 0.002). This income gradient is most pronounced for L2 (H = 14.602, p = 0.001), showing the more volatile and deteriorating animal welfare legislation reform trajectories in major emerging economies. Lower-middle income countries record a mean AWPRI of 0.490, and their L3 scores (mean = 0.652) are substantially above the high-income mean (0.459). This indicates that lower-middle income countries face significant AI amplification risk despite moderate governance baselines.
Relevant scholarship widely acknowledges the United Kingdom as a global leader in animal welfare legislation [5, 3], and its record of the lowest composite AWPRI score (0.308) in our sample, presented in this study, aligns with that assessment. However, as the enforcement gap documented in Section 2 illustrates, legislative leadership and enforcement capacity can diverge substantially. Despite how the L2 of our AWPRI is designed to address, the law enforcement gap cannot be fully identified by our model. In the coming months, we will continue to refine and enrich our AWPRI model, so as to better feature the policy risk index at the intersection between AI and animal welfare.
5.3 Temporal Trajectories and Policy Urgency
Moreover, our temporal trend analysis reveals that risk trajectories diverge significantly between country groups. Five countries exhibit statistically significant worsening trends (Thailand, Brazil, South Africa, China, Argentina), while ten show statistically significant improvements (Canada, the Netherlands, France, Japan, the United Kingdom, Sweden, Germany, the United States, Denmark, Australia). The countries recording the steepest worsening—Thailand (β = 0.005 per year) and Brazil (β = 0.004)—are major global livestock producers with limited domestic AI governance frameworks and deteriorating civic space indicators. The ARIMA projections indicate that this divergence is expected to persist to 2030 if there is an absence of intervention, with Thailand, Brazil, and Argentina projected to remain at or above the Critical Risk thresholds.
5.4 Implications for Governance
In this study, we find that, first, AI governance frameworks have to clearly incorporate animal welfare as a regulatory domain. The L3 dominance finding, and the DiD result that high-AI-governance-risk classification predicts broader AWPRI deterioration, indicate that generic AI readiness metrics are insufficient to identify welfare-specific risks. Second, the law enforcement dimension of animal welfare governance, inadequately featured in legislative text alone, requires investment. The United Kingdom case illustrates that legislative leadership and enforcement capacity can diverge substantially. Third, the projected worsening trajectories for Thailand, Brazil, and Argentina suggest that international governance instruments analogous to the EU Deforestation Regulation [25]—which conditions market access on land-use compliance—could be extended to encompass verifiable animal welfare compliance along agricultural supply chains.
6. Limitations
We have to declare that this paper is subject to several limitations. First, the AWPRI relies on publicly available data sources, with approximately 7.3% of observations imputed via linear interpolation within country time series. The imputation preserves country-level temporal trends but may introduce bias in years where missing data are non-random regarding animal welfare governance conditions.
Second, equal layer weighting, while justified by the OECD–JRC handbook [21] and validated by the sensitivity analysis, remains a methodological assumption. The sensitivity analysis demonstrates that ±10 percentage-point perturbations do not change country rankings or cluster assignments, but perturbations beyond this range may result in different empirical outcomes.
Third, the aforementioned partial endogeneity of the DiD analysis is a substantive limitation. The treatment variable (ai_governance_risk) is one of five constituent variables within L3, creating a mechanical component in the DiD coefficient. The DiD should be interpreted as evidence of the association between AI governance risk classification and broader AWPRI trajectories, but not as a causal estimate of AI governance divergence on animal welfare outcomes. Fourth, the AWPRI measures policy risk but not animal welfare outcomes directly. Cross-validation against farm-level indicators, such as mortality rates and stocking density violations, is required to establish whether risk scores correspond to observable differences in animal welfare conditions. Fifth, the 25-country sample in this exploratory study is not globally representative. Key livestock-producing economies such as Indonesia, Pakistan, and Ethiopia are absent due to data constraints. In the scale-up phase study, we will address this shortcoming with more extensive data ingestion and analysis.
7. Conclusion
This paper introduces the AWPRI as the first longitudinal, cross-country, AI-sensitive composite risk index for animal welfare governance. Applied to 25 countries over 2004–2022 (N = 475), the AWPRI identifies AI Amplification Risk (L3) as the dominant contributor to composite policy risk. The DiD analysis finds that countries identified as high-AI-governance-risk carry AWPRI scores 0.080 points higher than their low-risk counterparts (β = 0.080, p < 0.001), with the effect concentrated in the L3 component (β = 0.200, p < 0.001). Country rankings and cluster assignments are robust to layer weight perturbation (mean Spearman ρ = 0.986; ARI = 1.000). Our ARIMA projections, furthermore, indicate that Thailand, Brazil, and Argentina face continued deterioration by 2030 if there is an absence of policy intervention.
We reiterate that regulatory frameworks for agricultural AI must incorporate welfare-specific accountability mechanisms, as the current AI governance landscape systematically neglects this dimension. Law enforcement investment must accompany legislative development, given that the United Kingdom case illustrates that global leadership in legislative text is compatible with severe enforcement gaps. Finally, we recommend that international trade instruments should be extended to encompass verifiable animal welfare compliance, especially for high-risk supply chains originating in countries projected to worsen over the next decade.
Remark: The AWPRI interactive dashboard (https://awpri-dashboard.streamlit.app) provides public access to all country-year scores, layer decompositions, cluster classifications, and ARIMA projections.
References
[1] Food and Agriculture Organisation of the United Nations (FAO). (2023). FAOSTAT: Livestock primary data. https://www.fao.org/faostat
[2] Blattner, C. E., & Tselepy, J. (2024). For whose sake and benefit? A critical analysis of leading international treaty proposals to protect nonhuman animals. American Journal of Comparative Law, 72(1), 1–32. https://doi.org/10.1093/ajcl/avae018
[3] Hårstad, R. M. B. (2024). The politics of animal welfare: A scoping review of farm animal welfare governance. Review of Policy Research, 41(5), 679–702. https://doi.org/10.1111/ropr.12554
[4] Chaney, P., Jones, I. R., & Narayan, N. (2024). Beyond the unitary state: Multi-level governance, politics, and cross-cultural perspectives on animal welfare. Animals, 14(1), Article 79. https://doi.org/10.3390/ani14010079
[6] Animal Law Foundation. (2024). The enforcement problem: 2024 data. https://animallawfoundation.org/enforcement
[7] Neethirajan, S. (2024). Artificial intelligence and sensor innovations: Enhancing livestock welfare with a human-centric approach. Human-Centric Intelligent Systems, 4(1), 77–92. https://doi.org/10.1007/s44230-023-00050-2
[8] Papakonstantinou, G. I., Voulgarakis, N., Terzidou, G., Fotos, L., Giamouri, E., & Papatsiros, V. G. (2024). Precision livestock farming technology: Applications and challenges. Agriculture, 14(4), Article 620. https://doi.org/10.3390/agriculture14040620
[9] DataM Intelligence. (2024). AI in precision livestock farming market report 2024–2032. DataM Intelligence.
[10] Schillings, J., Bennett, R., & Rose, D. C. (2021). Exploring the potential of precision livestock farming technologies to help address farm animal welfare. Frontiers in Animal Science, 2, Article 639678. https://doi.org/10.3389/fanim.2021.639678
[11] Zhang, L., Guo, W., Lv, C., Guo, M., Yang, M., Fu, Q., & Liu, X. (2024). Advancements in artificial intelligence technology for improving animal welfare. Animal Research and One Health, 2(1), 93–109. https://doi.org/10.1002/aro2.44
[12] Tuyttens, F. A. M., Molento, C. F. M., & Benaissa, S. (2022). Twelve threats of precision livestock farming (PLF) for animal welfare. Frontiers in Veterinary Science, 9, Article 889623. https://doi.org/10.3389/fvets.2022.889623
[13] Elliott, K., & Werkheiser, I. (2023). A framework for transparency in precision livestock farming. Animals, 13(21), Article 3358. https://doi.org/10.3390/ani13213358
[14] Parlasca, M., Knößlsdorfer, I., Alemayehu, G., & Doyle, R. (2023). How and why animal welfare concerns evolve in developing countries. Animal Frontiers, 13(1), 26–33. https://doi.org/10.1093/af/vfac082
[16] Wolf, M. J., Emerson, J. W., Esty, D. C., de Sherbinin, A., & Wendling, Z. A. (2022). 2022 environmental performance index. Yale Center for Environmental Law & Policy.
[19] Hausman, J. A. (1978). Specification tests in econometrics. Econometrica, 46(6), 1251–1271. https://doi.org/10.2307/1913827
[20] Angrist, J. D., & Pischke, J.-S. (2009). Mostly harmless econometrics: An empiricist’s companion. Princeton University Press.
[21] Organisation for Economic Co-operation and Development (OECD) & Joint Research Centre (JRC). (2008). Handbook on constructing composite indicators: Methodology and user guide. OECD Publishing. https://doi.org/10.1787/9789264043466-en
[25] European Parliament & Council of the European Union. (2023). Regulation (EU) 2023/1115 of the European Parliament and of the Council. Official Journal of the European Union. http://data.europa.eu/eli/reg/2023/1115/oj
Appendix
Table A1. AWPRI Constituent Variables, Data Sources, and Coverage
Table A2. Pairwise Mann–Whitney U Tests with Bonferroni Correction (2022 AWPRI by Risk Tier)
Note. Critical tier n = 1 in k-means solution (China as singleton); comparisons involving Critical tier should be interpreted with caution. * p < 0.05; *** p < 0.001.
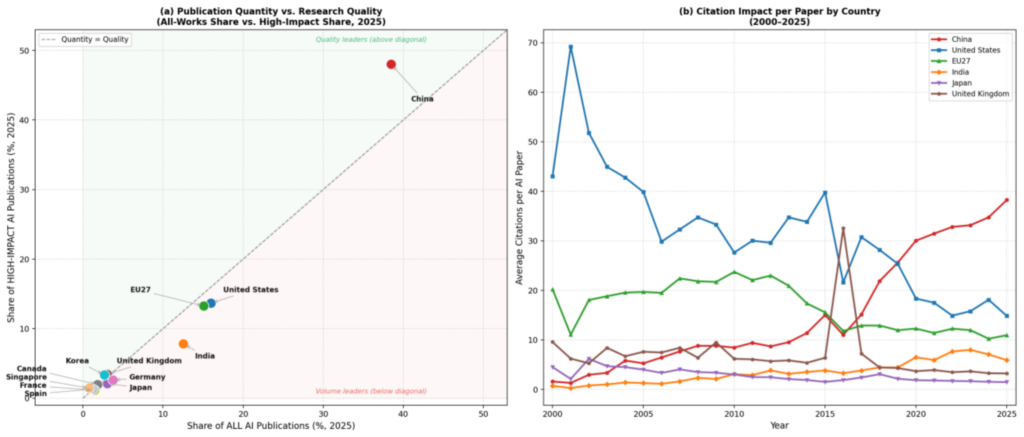
This study investigates the shifting global dynamics of Artificial Intelligence (AI) research by analysing the trajectories of countries dominating AI publications between 2000 and 2025. Drawing on the comprehensive OpenAlex datasets and employing fractional counting to avoid double attribution in co-authored work, the research maps the relative shares of AI publications across major global players. The analysis reveals a profound restructuring of the international AI research landscape. The US and the European Union (representing EU27), once the undisputed and established leaders, have experienced a notable decline in relative dominance, with their combined share of publications falling from over 57% in 2000 to less than 25% in 2025. In contrast, China has undergone a dramatic ascent, expanding its global share of AI publications from under 5% in 2000 to nearly 36% by 2025, therefore emerging as the single most dominant contributor. Alongside China, India has also risen substantially, consolidating a multipolar Asian research ecosystem. These empirical findings highlight the strategic implications of concentrated research output, particularly China’s capacity to shape the future direction of AI innovation and standard-setting. Beyond publication volume, the study further examines research quality by comparing each country’s share of high-impact publications against its overall output, and analyses citation impact trajectories across major players. The findings show that in addition to China leading in volume, the country has also recently led in high-impact publications. Such an observation challenges the general assumption that Western powers retain dominance in high-impact AI scholarship.
Keywords
artificial intelligence; scientometrics; bibliometric analysis; global research dominance; academic publications; United States; China; European Union
The influence of the field of Artificial Intelligence (AI) has rapidly expanded to diverse domains, including global economic competitiveness (Khan et al., 2024), geopolitical relations (Gerlich, 2024), and societal transformation (Gohil, 2023). Its global impact spans sectors from healthcare (Mahdi et al., 2023) and finance (Aldasoro et al., 2024) to defence (Carlo, 2021) and manufacturing (Hong et al., 2025), making the capacity for innovation in AI an impactful indicator of a country’s future strength and competence. Consequently, understanding the global landscape of AI research—specifically, which countries dominate the production of scholarly work and how this dominance evolves over time—is necessary for policymakers, educators, and industry leaders to make informed decisions.
While global leadership in AI is often quantified through metrics such as venture capital investment, the number of successful startups, or the volume of patent applications (HAI, n.d.)—all valuable indicators of commercialisation—the fundamental basis of enduring technological capability remains its academic publication record. Scholarly articles not only record new discoveries and algorithmic breakthroughs but also act as a leading indicator, signalling emerging research directions, highlighting institutional and national strengths, and supplying the open, foundational knowledge upon which future technological development is built. Therefore, a systematic, long-term analysis of the geographical distribution of AI research output, specifically academic publication dominance, provides a crucial perspective which is often overlooked or underestimated by economic indicators.
This study leverages the comprehensive, open-source OpenAlex datasets to map the shifting dynamics of AI publication dominance across the world’s leading research countries and regional blocs between 2000 and 2025. In this study, I treat the year 2000 as a meaningful baseline, predating both the rapid deep learning advancement of the early 2010s and China’s surge in AI publication output. Analysing data between 2000 and 2025 allows us to understand the entire transition in global AI publication competition from Western-led dominance to the present multipolar landscape. This has created a competitive environment where the historic dominance of established players, such as the US and the European Union (EU), is actively being challenged (Bertelsmann Foundation, 2023). This study offers an opportunity to track the shifting trajectories of these established players alongside the rapid ascent of new powerhouses, most notably China, whose national AI strategy has explicitly prioritised academic output. By observing these simultaneous trajectories, I can dissect and comparatively analyse the evolution of a global and fiercely contested research frontier. To be precise, this study aims to satisfy two research aims. First, I am going to map the longitudinal trajectories of AI publication dominance across major countries and regional blocs between 2000 and 2025. Second, I am going to comparatively analyse whether countries with notable changes in publication volume have proportional variations in research quality and citation impact, and to examine the causal dynamics within these trajectories.
Literature Review
The study of scientific progress and the measurement of national innovation capacity, known as scientometrics, forms the theoretical foundation for this research (Mingers & Leydesdorff, 2015). In recent decades, bibliometric analysis has become the standard tool for assessing research performance (Hood & Wilson, 2001). However, applying these methods to highly dynamic, interdisciplinary fields like AI presents unique methodological challenges. The literature review is structured around two key areas: the definition and measurement of AI research and the historical and contemporary global landscape of AI production.
Defining and Measuring AI Research
A central challenge in accurately tracking AI research stems from its multidisciplinary nature. The AI field bridges core computational disciplines, such as computer science and mathematics, and overlaps with engineering, cognitive science, and specialist domains like biomedicine (Abbonato et al., 2024). Consequently, early scientometric studies often relied on narrow, fixed keyword searches or incomplete institutional affiliation lists, a method prone to both exclusion (by missing new subfields) and bias (by over-representing traditional computer science outlets) (Bruce et al., 2025). The consensus in modern scientometric practice, exemplified by approaches adopted by the OECD.ai Observatory, designs the methodology beyond simple keyword approaches. Instead, leveraging comprehensive, curated databases like OpenAlex, which categorise papers based on robust, continuously updated field-of-study taxonomies, is crucial. This advanced approach, adopted in this research paper, focuses on papers explicitly classified under “AI” or “machine learning.” While this provides a conservative yet high-confidence measure of core AI research output, it ensures consistency and avoids the unreliable categorisation stemming from emerging terminology.
Liu et al (2021) introduced a bibliometric definition for AI using a hybrid approach—starting by searching core keywords, then extracting high-frequency terms—and compared the outputs against three existing search strategies applied to Web of Science data. Liu et al. (2021) concluded that different search strategies result in substantially different corpus sizes and compositions, while there is no single universally agreed bibliometric definition for AI. Also, Färber & Tampakis (2024) used scientometric data across multiple scholarly databases to compare academic- and company-authored AI publications. Their findings imply that taxonomy choices are contingent on research objectives. Gao et al. (2024) empirically analysed patent-cited AI papers relative to the non-patent-cited counterparts from 1999 to 2013. Their findings show that patent-cited papers have stronger scientific impact, especially for conference publications. Gao et al.’s (2024) study highlights that not all AI papers are equal in impact.
Furthermore, the literature debates the appropriate counting methodology (Mingers & Leydesdorff, 2015). Simply counting the total number of published research papers leads to inflation due to increasing co-authorship. Consequently, fractional counting, where credit for a publication is divided equally among the affiliated institutions or countries (as detailed in my methodology), has become the gold standard for accurately representing the proportional contribution of each entity. Fractional counting is employed in the methodological design of this research paper.
Publication volume, despite being an indicative metric, fails to fully represent a country’s scientific advancement in AI. Bibliometric literature distinguishes between quantity and quality, and citation counts are the most widely used proxy for research quality and impact (Hood & Wilson, 2001). High citation counts do not necessarily follow from high publication volume. A country can dominate in output whilst failing to earn proportional scientific influence, and vice versa (Färber & Tampakis, 2024). Such a quality–quantity differentiation is especially obvious for AI publications, as demonstrated by Gao et al. (2024).
The Evolving Global Landscape of AI Dominance
The narrative of global AI dominance has undergone a seismic shift since the turn of the millennium. Prior to 2010, the US and Western Europe, particularly the EU bloc, were the undisputed leaders in AI publications (Bertelsmann Foundation, 2023). This early dominance was a direct reflection of their well-established university systems, robust governmental funding mechanisms dating back to the mid-20th century, and a culture of open academic research (Lecun et al., 2015). The pre-2010 era was characterised by steady but incremental growth among these established players, who benefited from decades of intellectual and infrastructural investment. A comparable trajectory has been documented by Carchiolo and Malgeri (2024), whose bibliometric analysis identifies a crossover between China and the US in AI publication volumes. I verify such a pattern in Figure 5 of this study. However, it is noteworthy that Carchiolo and Malgeri’s (2024) analysis relies on Scopus but not OpenAlex, employs raw publication counts but not fractional percentage shares, uses a bespoke set of 18 keywords but not the OECD field-of-study taxonomy, and covers a different timeframe (1995-2023), meaning that my study is methodologically different than, and complementary to, theirs.
The decline of the West in AI publications can partly be justified structurally. It is noteworthy that following the UK’s formal departure from the EU in January 2020, this study accounts for the Brexit by treating the UK as an independent trajectory, excluding from the EU27 aggregate at any point, including pre-2020 years. An European Commission report (Balland et al., 2025) finds that European research and innovation hubs are significantly less closely connected than their American counterparts, especially in AI technologies. The report attributes this situation to the structural fragmentation across national borders, such as separate regulatory regimes, decentralised funding architectures, and limited cross-regional collaboration. In the US, in contrast, Jurowetzki et al. (2021) quantify the growing flow of AI researchers from academia into private technology companies. They discover that researchers specialising in deep learning and those with higher citation impact are most likely to transition from academia to private technology companies. Such a circumstance raises concerns about the privatisation of AI knowledge and the weakening of the public academic research sphere. As a result, this circumstance explains why the American academic publication share is declining even though the country remains commercially dominant. The research activity has migrated out of the academic sphere into industry labs whose outputs are less likely to appear in the OpenAlex corpus. Jurowetzki et al. (2025) second that highly cited researchers from prestigious institutions are relocating to major tech firms, where, upon the transition, their research shows reduced novelty and citation impact.
However, the literature from the past decade highlights the dramatic, centrally-driven emergence of East Asian nations, particularly China (Hamilton-Hart & Yeung, 2021). Numerous policy analyses and bibliometric reports track China’s aggressive, sustained investment in AI talent acquisition, large government funding directed by national strategic plans, and infrastructural build-out, all leading to an exponential rise in publication volume (Podda, 2025). This literature suggests that China’s rise in AI research did not only contribute to the overall global output; rather, it challenged the relative dominance of the West (Podda, 2025). My research, which uses the percentage of global AI publications by country as the key measurement metric, specifically addresses the comparative nature of this global transition, in order to track relative dominance trajectories of given countries. The empirical findings, which demonstrate the US and EU27 shares of global AI publications falling dramatically while China’s share has surged to over one-third of the global total by 2025, indicate the need for close examination of the underlying competitive dynamics and their geopolitical implications.
Methodology and Data
This study employs a quantitative, data-driven approach to analyse the shifting global dominance in AI publications between the years 2000 and 2025. The analysis focuses on tracking the publication output trajectories of countries to reveal the relative evolution of the global AI research landscape. The subsequent subsections detail the data source, criteria for identifying AI publications, and the specific counting methodologies employed for both publication quantity and cross-national collaboration.
In this study, I examine 12 units of analysis (meaning 11 individual countries and the EU27 as a collective regional bloc), based on two selection criteria. First, each unit represents a consistently leading contributor to global AI publication output between 2000 and 2025, accounting for the substantial majority of fractional-counted global share in any given year. Second, the selected units correspond to the primary geopolitical actors in contemporary AI governance, strategy and competition discourse, which include the US, China, the EU, India, the UK and other leading Western and Asian economies. I ground the bibliometric analysis in the broader policy context to which the empirical findings are intended to contribute. Countries excluded from this study is due to the fact that their fractional share of global outputs remains sufficiently small where their inclusion would not materially affect the comparative trajectories this study is designed to explore.
Data Source and Scope
The primary data source for this research is publicly accessible OpenAlex datasets (Priem et al., 2022), downloaded from a comprehensive, open-source bibliographic database. OpenAlex succeeded the Microsoft Academic Graph (Sinha et al., 2015; Wang et al., 2019) and is currently maintained by The OpenResearch Foundation. It provides extensive coverage, encompassing over 245 million research outputs, including journal articles, conference proceedings, and workshop papers. The datasets offer rich bibliographic records, including information about authors, institutions and their corresponding countries, publication venues, and fields of study. Furthermore, all records are tagged with a set of 65,000 topics sourced from Wikidata, and the datasets include citation data, which facilitates the analysis of research impact and citation networks. Its comprehensive nature and interoperability make it an ideal foundation for large-scale scientometric studies. On OECD.ai, the datasets downloaded are in the form of static csv files. These publicly accessible datasets are not compiled from a live query via the OpenAlex API. I should note that publication figures for 2025 may underrepresent the full annual outputs, as indexing delays may occur where work recently published in late 2025 may not be made available within the OpenAlex database. As I developed the descriptive and the inferential analysis outputs in late 2025 and early 2026 respectively, the 2025 data presented in this paper should be interpreted as provisional but not complete.
Identification of AI Publications
The research scope is focused on the subset of publications relevant to AI, aligning with the criteria utilised by the OECD AI Policy Observatory (OECD.ai). A publication within the OpenAlex datasets is categorised as an AI paper if it is tagged during the concept detection operation with a field of study belonging to either the “AI” or the “machine learning” fields within the OpenAlex taxonomy. It is important to note that results from adjacent fields of study—such as “natural language processing,” “speech recognition,” and “computer vision”—are only included if they also concurrently belong to the aforementioned core “AI” or “machine learning” classifications (OECD.ai Observatory, n.d.). As this classification relies on rigorous taxonomic assignment, the resultant body of AI publications for the analysis is likely to be conservative, providing a high-confidence set of AI-focused research outputs.
Publication Counting Methodology
To establish the absolute trajectory of publication output for each country, a fractional counting methodology is employed to avoid the problem of double-counting in co-authored publications. While each publication counts as one unit towards an entity (a country or an institution) in absolute terms, credit for multi-authored papers is distributed equally among the institutions involved. Specifically, a publication written by multiple authors from different institutions is fractionally split among each author based on their institutional affiliation. For instance, if a publication lists four authors affiliated with institutions in the US, one author from an institution in China, and one author from a French institution, the publication is attributed as follows: the US receives 4/6 (four-sixths) of the publication count, China receives 1/6, and France receives 1/6 (OECD.ai Observatory, n.d.). Such counting strategies ensure that the quantity measure accurately reflects the distributed contribution of each country. It is important to note that fractional counting does not fully resolve cases where a single author holds simultaneous affiliations across two or more countries. For example, a researcher with joint appointments at institutions in the US and China. In such cases, credit assignment depends on how OpenAlex disambiguates affiliation metadata at the record level, which may not be consistent across all entries in the datasets. Such an approach represents a known limitation of bibliometric analyses relying on institutional affiliation data and is acknowledged as such in the interpretation of empirical findings.
Methods
I conducted all quantitative analyses via Python (for inferential analysis) and STATA (for descriptive analysis). I processed multiple datasets directly downloaded on OECD.ai via OpenAlex and structured in Python using the pandas library for data manipulation. My descriptive trend analysis and longitudinal trajectory mapping were performed across 2000-2025. I, then, assessed concentration dynamics using the Herfindahl–Hirschman Index (HHI), with trend significance evaluated through the Mann–Kendall non-parametric test and magnitude estimated via Sen’s slope. I further examined convergence and divergence patterns through both sigma-convergence (σ-convergence) and beta-convergence (β-convergence) regression. I identified structural breaks in country-level publication trajectories using the Bai–Perron multiple breakpoint procedure. I, moreover, explored the relationship between publication volume and high-impact output share through a panel regression framework comparing each country’s share of high-impact publications against its overall output share. I, in addition, tested causal dynamics between country trajectories using panel Granger causality analysis. The figures I created for inferential analysis were built using the matplotlib and seaborn libraries in Python, while those for descriptive analysis were made via STATA.
This study specifically uses the datasets displaying the percentage of AI publications instead of the actual number of AI publications by country over time. This means in any given year, the cumulative percentage of AI publications by all countries globally is 100%. This study decides to use the percentage of AI publications by country metrics as this research paper focuses on comparative data analysis between globally dominant countries. Studying the percentage of AI publications by country longitudinally allows us to understand the trajectory of such dominance of a given country (1) over time and (2) relative to that of other countries.
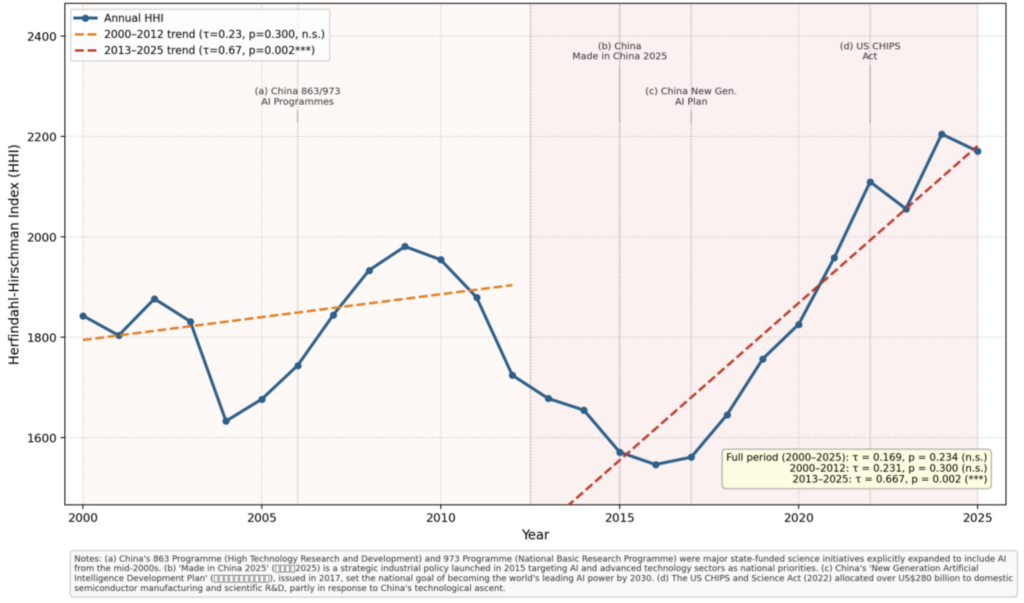
I performed the HHI as a standard measure of market/system concentration, calculated by summing the squared publication shares of all countries in the datasets in a given year. Values closer to zero indicate dispersed output across many countries; higher values represent concentration in fewer dominant players. Unlike descriptive share trajectories, which show individual country trends, the HHI allows featuring the system-level distribution of AI publication output in a single annual index value. This approach enables my assessment on whether the global landscape as a whole is becoming more or less concentrated over time. I then applied the Mann–Kendall non-parametric test to examine whether any trend in the HHI time series is statistically significant, and Sen’s slope to estimate the magnitude of change per year. Mann–Kendall makes no assumption of normality in the time series and is robust to outliers, which satisfy the features of a 25-year annual index.
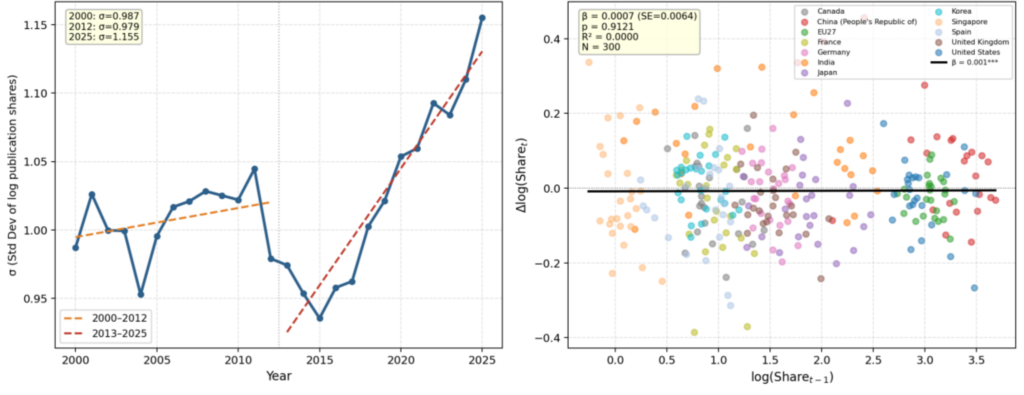
I, next, performed the σ-convergence and β-convergence as the two complementary approaches drawn from economic growth convergence literature. σ-convergence measures whether the dispersion of publication shares across countries—measured by the standard deviation of shares in each year—is narrowing or widening over time. β-convergence tests whether countries with initially lower shares tend to grow faster than those with initially higher shares, using a regression of share growth on initial share level. The convergence framework assesses whether the global AI publication landscape is becoming more equal or polarised across countries. These complementary approaches allow testing whether cross-country variation in publication shares is shrinking or expanding over time, and whether initially lower-share countries are closing the gap with initially higher-share counterparts.
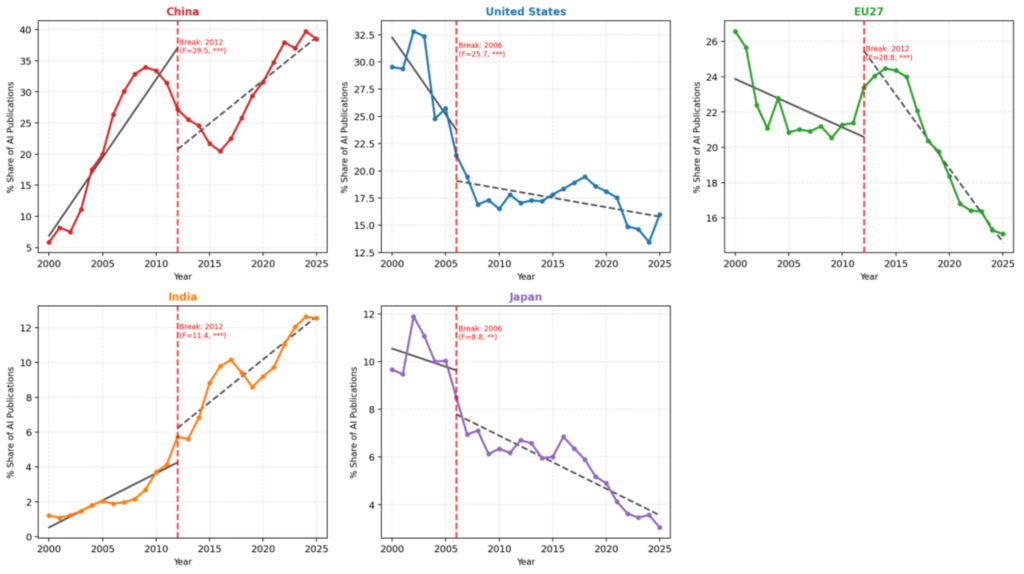
I also carried out the Bai–Perron procedure to statistically identify multiple structural breaks (meaning points in a time series where the underlying trend changes significantly). This procedure tests sequentially for the presence and location of breakpoints in each country’s publication share trajectory. The following figures suggest that several countries experienced notable directional changes at specific points in time, especially around the early 2010s. The Bai–Perron procedure provides a data-driven test for the inflection points. Carrying out the Bai–Perron procedure is highly suitable given the nature of my datasets because multiple structural breaks maybe present in a single series and this approach can statistically identify them. In doing so, I am able to examine whether each country’s AI publication share trajectory contains one or more statistically significant structural breaks and at what year(s) these breaks per se occur. Identifying a common structural break year across multiple countries provides evidence of a system-level transition in the global AI publication landscape.
I, in addition, conducted a panel regression analysis to compare each country’s share of high-impact AI publications against its share of overall AI publications covering all 12 units of analysis from 2000 to 2025. The dependent variable is the high-impact publication share; and the independent variable is the overall publication share. I included country and year fixed effects to control for unobserved heterogeneity across units and time. I would like to test whether a country’s share of overall AI publications is a reliable predictor of its share of high-impact publications. I would like to examine whether specific countries systematically over- or under-perform on AI publication quality relative to their volume, too.
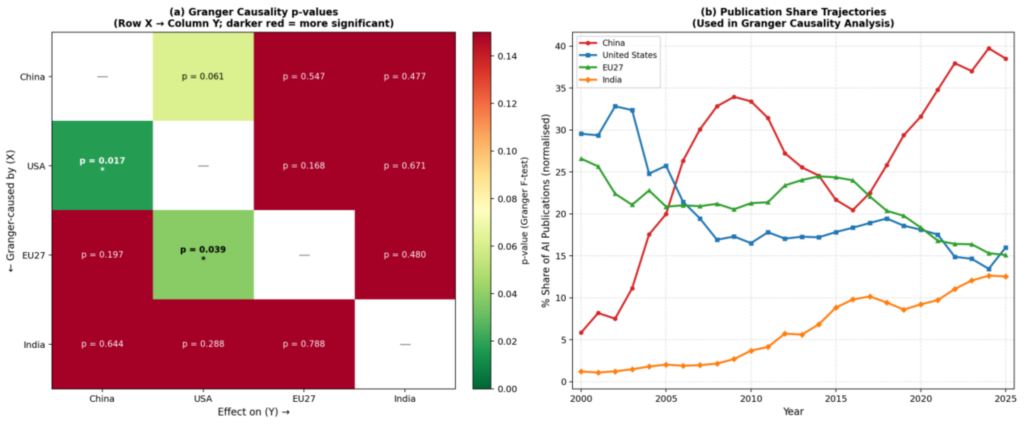
I, last but not least, performed the Granger causality to statistically test whether past values of one time series help predict future values of another. I tested for all country pairs using a vector autoregressive framework. The descriptive and aforementioned inferential analyses establish what has changed in the global AI publication landscape. Granger causality, furthermore, addresses why such changes have occurred. This means I evaluated whether knowing a country’s trajectory in prior years improves prediction of another country’s trajectory beyond what the latter’s history record already suggests.
Empirical Findings
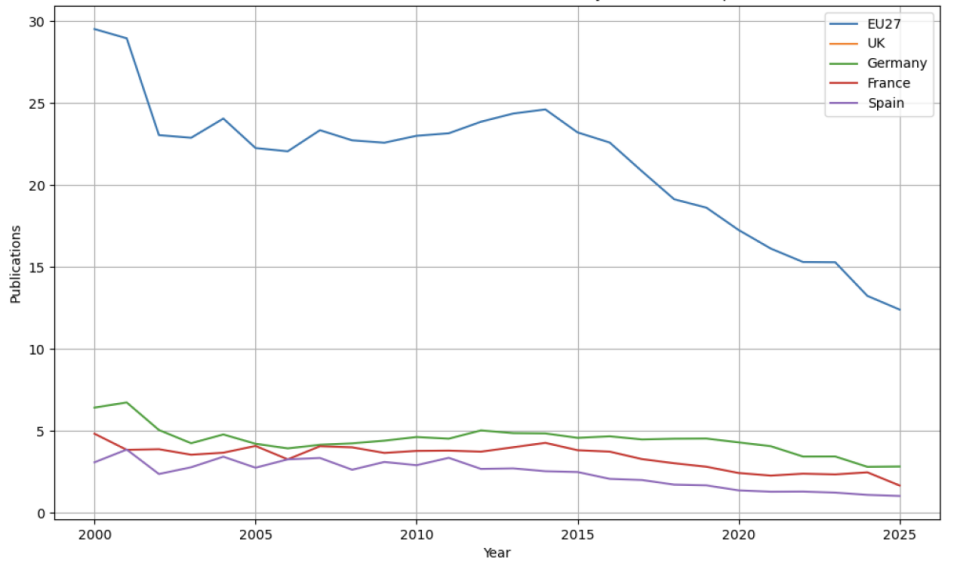
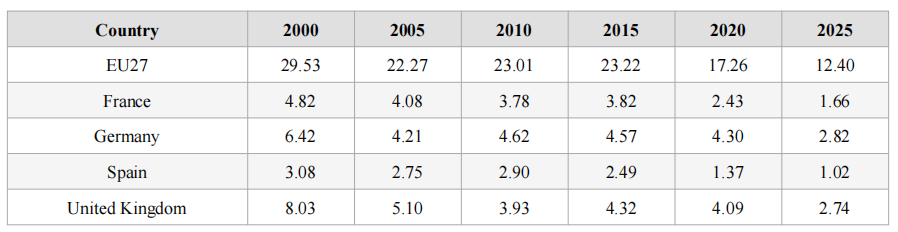
In this research, I focus on major global players in AI publications in Europe, Asia and North America. Figure 1 and Table 1 show the AI publications over year for selected European countries. EU27 refers to the 27 member states of the EU. It is noteworthy that the UK left the EU on 31st January 2020 after Brexit. The UK is treated as a fully independent trajectory throughout this study and is not included within the EU27 aggregate at any point, including pre-2020 years, to ensure longitudinal consistency. I see that EU27 shared 29.53% of global AI publications in 2000. The share dropped to some 22% to 23% between 2005 and 2015. Over the last decade, such figures have continued to drop significantly, to 12.40% in 2025. Among Western European countries, the UK and Germany have been leading AI publications from 2000 to 2025.
Figure 1:
Publications Over Year for Selected European Countries
Table 1:
Publications Over Year for Selected European Countries
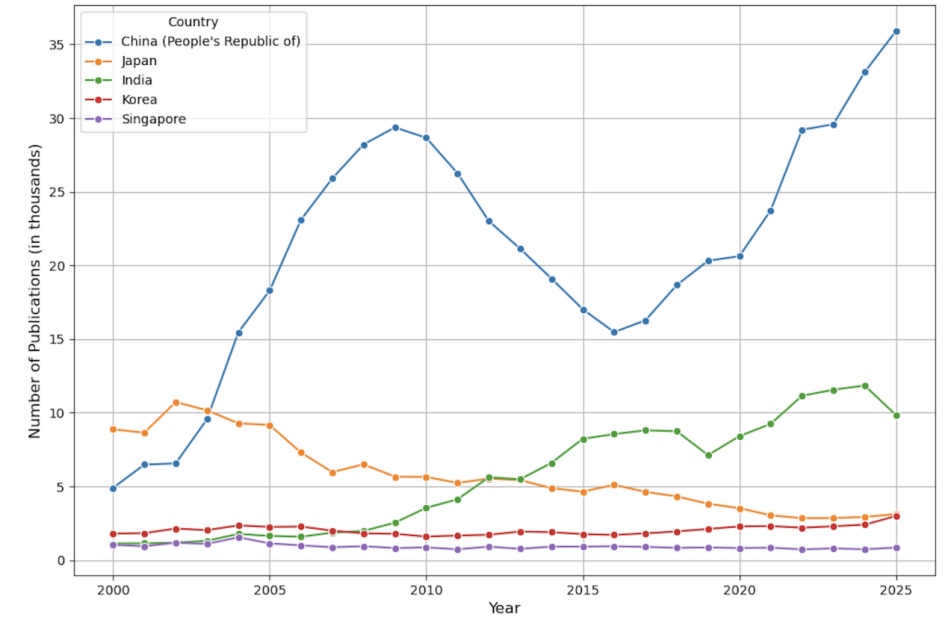
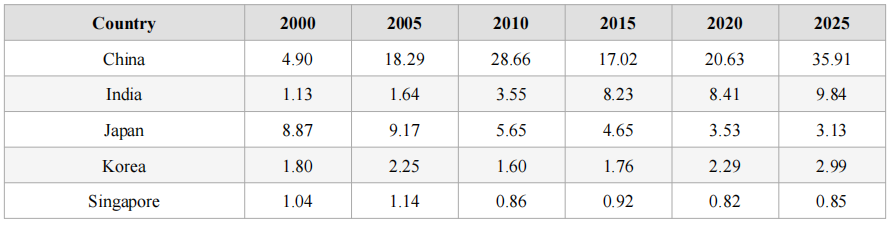
Figure 2 and Table 2 show the AI publications over year for selected Asian countries. In Asia, Japan used to be a very major global player in AI publications in the 2000s. Its contribution to global AI publications, however, has declined since 2010s. In contrast, China only contributed to just below 5% of global AI publications in 2000. In 2005, the figure soared to 18.29%. China’s dominance of global AI publications has continued to grow, reaching about 36% in 2025. Over the last decade, other than China, India has become the leading Asian player in contributing to global AI publications (about 10% of all AI publications are authored by Indian researchers in 2025).
Figure 2:
Publications Over the Year for Selected Asian Countries
Table 2:
Publications Over the Year for Selected Asian Countries
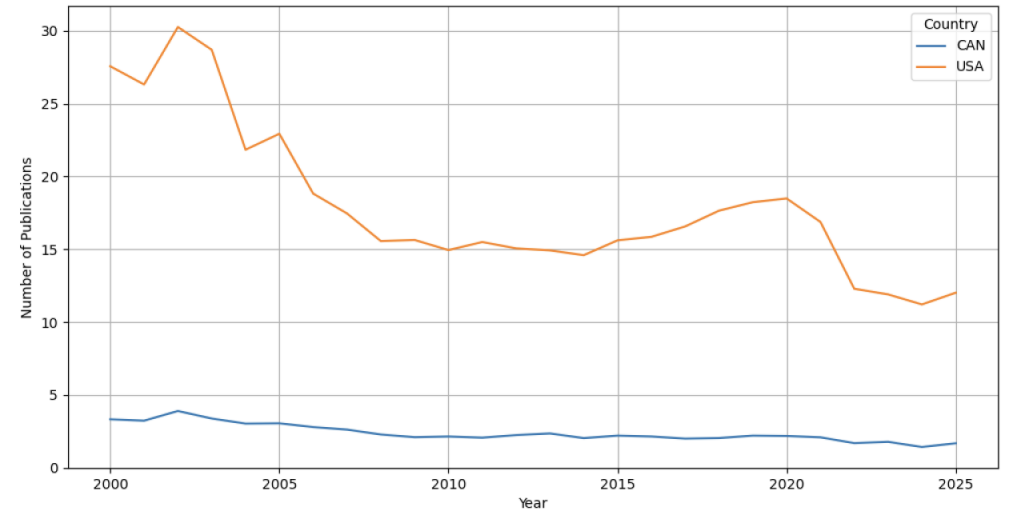
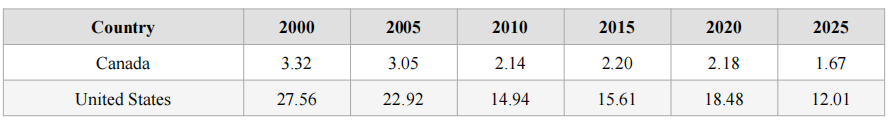
Figure 3 and Table 3 show the AI publications over year for selected North American countries. In North America, Canada’s contribution to AI publications has dropped by half between 2000 (3.32%) and 2025 (1.67%). The US, while maintaining its global dominance in AI publications, has also seen its percentage of AI publications cut by half between 2000 and 2025, from 27.56% to 12.01%.
Figure 3:
Publications Over Year for Selected North American Countries
Table 3:
Publications Over Year for Selected North American Countries
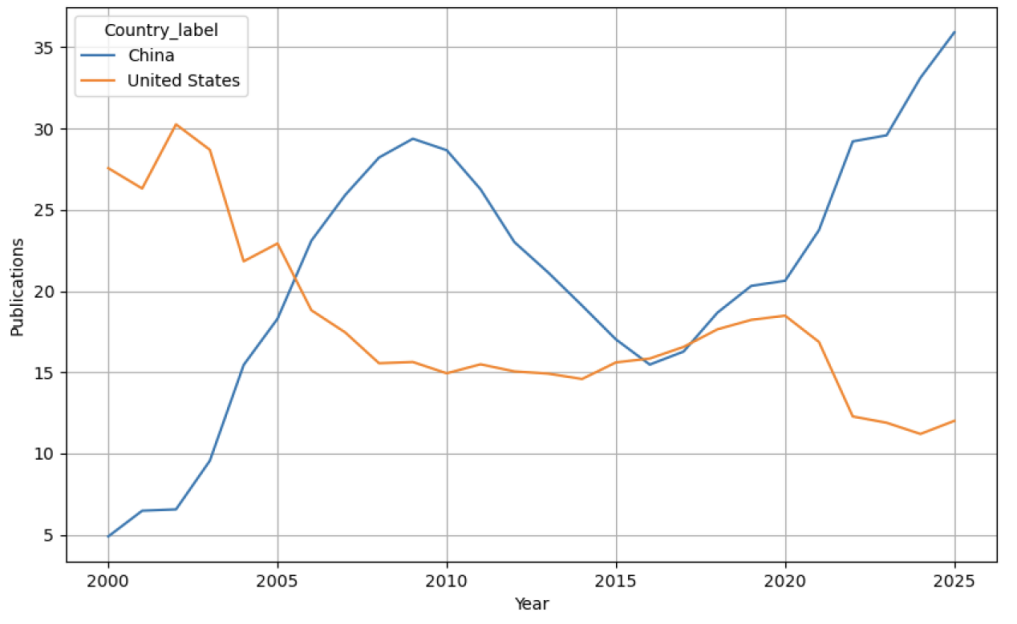
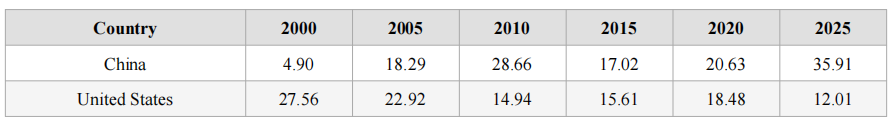
Figure 4 and Table 4 show the AI publications over year between the US and China. These empirical outputs allow us to comparatively analyse the trajectories of percentage of AI publications by the world’s two leading forces. I see that in 2000, the US dominated 27.56% of global AI publications, which was over five times higher than the 4.90% from China. Between 2005 and 2006, China’s global AI publication contributions reached the level of the US. From 2006 to 2016, China’s contributions to global AI publications outnumbered those of the US. Their contributions to global AI publications maintained at very close levels between 2016 and 2017. However, since 2020, China’s dominance in AI publications has surged, while the US’s dominance has declined. In 2025, China has contributed three times as many AI publications as the US (35.91% vs 12.01%).
Figure 4:
Publications Over Time for United States and China
Table 4:
Publications Over Time for United States and China
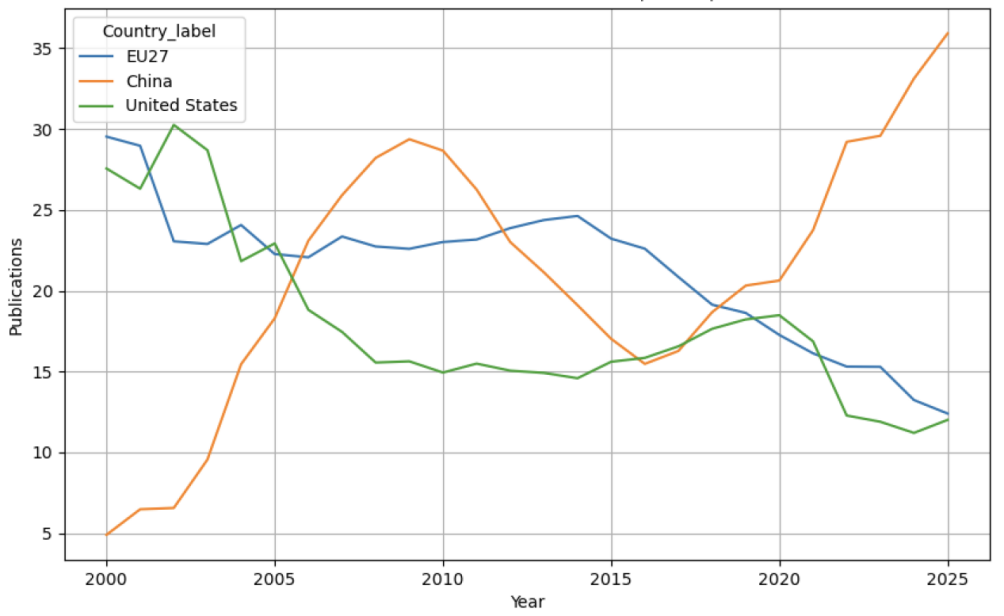
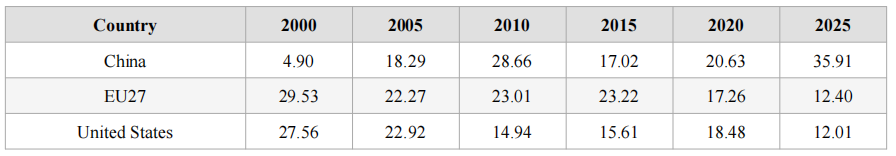
Figure 5 and Table 5 supplement the preceding empirical outputs by showing the AI publications over year between the US, China and EU27. I see that in 2000, the US and EU27 were the two leading powerhouses in contributing to global AI publications. In 2005, China joined the US and EU27 to become one of the clear-cut leading global players in AI publications. All three players’ dominance in AI publications had been relatively close until 2020. Since 2020, the contributions to AI publications by the US and EU27 has declined consistently, while China’s dominance has reached new heights.
Figure 5:
Publications Over Time for United States, China, and EU27
Table 5:
Publications Over Time for United States, China, and EU27
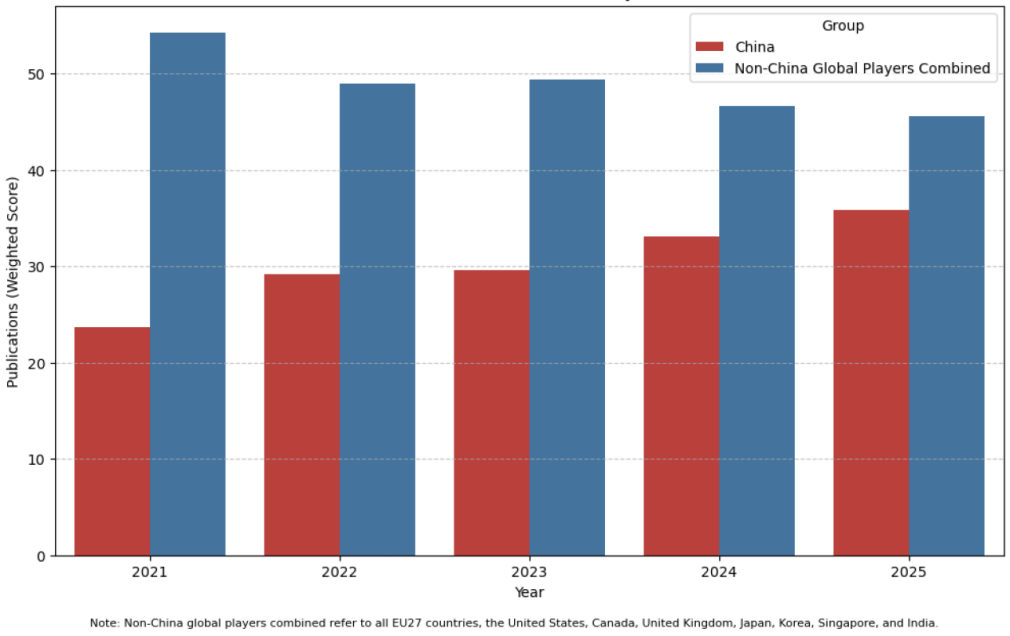
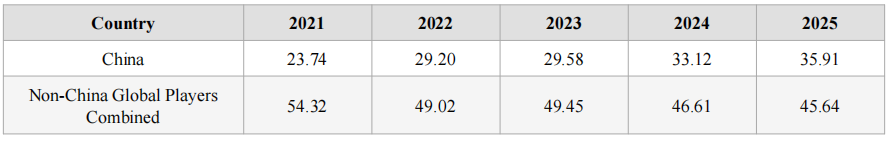
Figure 6 and Table 6 show the AI publications over time between China and non-China global players combined. Non-China global players combined refers to all EU27 countries, the US, Canada, the UK (where applicable), Japan, Korea, Singapore and India. I can see that all these major global players (including China) have combined for over 78% of AI publications annually between 2021 and 2025. In 2021, China’s contributions were fewer than half of those from all other major global players combined (23.74% vs 54.32%). Yet, China’s dominance has continued to grow, while the combined contributions from all non-China major global players have dropped slightly year by year, between 2021 and 2025. In 2025, China’s contributions to global AI publications reached 35.91%, while all non-China global players combined for 45.64%.
Figure 6:
Publications Over Time for China and Non-China Global Players Combined
Table 6:
Publications Over Time for China and Non-China Global Players Combined
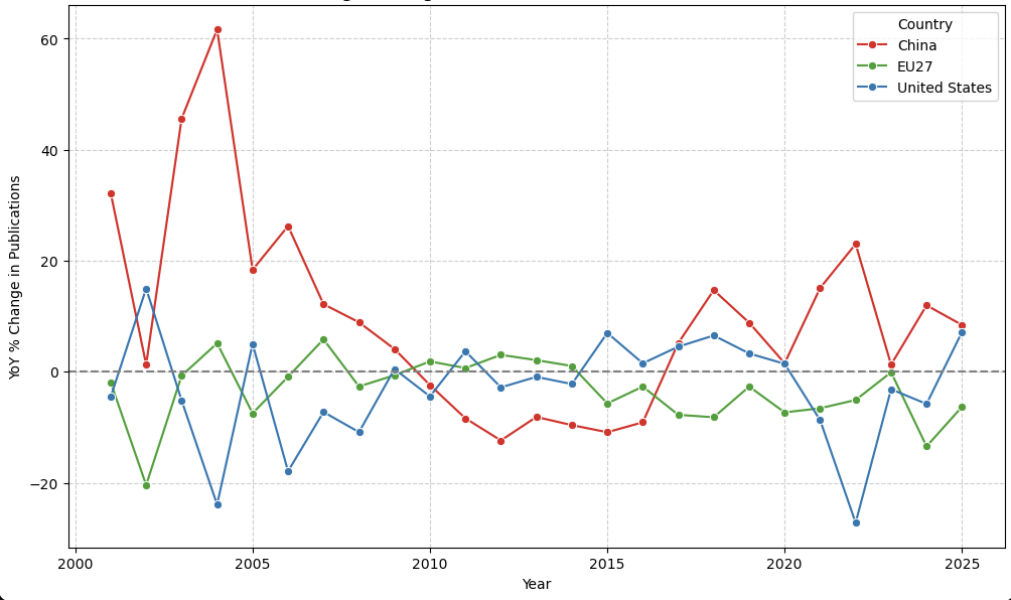
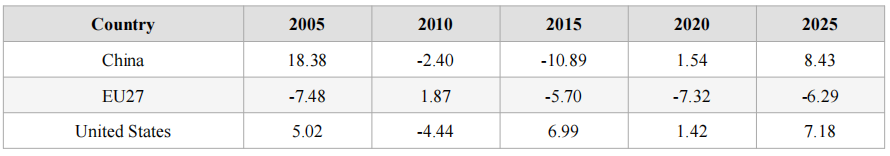
Figure 7 and Table 7 show the year-over-year (YOY) percentage change in publications over year between the US, China and EU27. I see that China’s YOY percentage change resulted in a boom during mid-2000s. China experienced another YOY percentage change boom in early 2020s. Whenever China’s YOY percentage change booms occurred, the US’s YOY percentage changes plummeted. This is understandable as percentage change in global AI publications is a relative measurement. When one dominant player results substantial positive YOY change, logically the other dominant player ends up having notable negative YOY change.
Figure 7:
Year-Over-Year Percentage Change in Publications for United States, China, EU27
Table 7:
Year-Over-Year Percentage Change in Publications for United States, China, EU27
Figure 8 presents the HHI analysis of global AI publication concentration across the study period. The index shows a sustained upward trend, indicating that output has become progressively more concentrated among a smaller number of dominant players. The Mann–Kendall test confirms that the trend is statistically significant in the 2013-2025 sub-period (τ=0.67, p=0.002), with Sen’s slope estimating concentration increasing at +8.16 HHI units per year. The finding complements the individual country trajectories presented in Figures 1-7, by highlighting the system-level distributional transition that single-country graphs fail to display. The global AI publication landscape has become structurally more concentrated since 2013—the time period where I witnessed deep learning breakthrough and the intensification of China’s national AI investment strategy—with a shrinking number of dominant players accounting for an increasing share of global output.
Figure 8 Market Concentration of AI Publication Shares (HHI), 2000-2025, among 12 Major Global AI-Publishing Countries
Figure 9 presents the convergence analysis of AI publication shares across the study period. The σ-convergence results show that the standard deviation of publication shares increasing from σ=0.987 in 2000 to σ=1.155 in 2025. I can see a particularly notable upward trend in the 2013-2025 sub-period, indicating that cross-country dispersion has grown over time. The β-convergence regression shows there is no statistically significant relationship between initial publication share and subsequent growth rate (β=0.0007, p=0.9121, R²=0.0000, N=300). This finding indicates that countries with initially lower publication shares have not increased their shares at a faster rate than those with initially higher shares. Overall, the empirical findings shown in Figure 9 suggest the global AI publication landscape is diverging but not converging. Here, dominant players are not being systematically challenged by lower-share countries, and dispersion across the countries studied has widened considerably since 2013.
Figure 9(a) (Left) σ-Convergence (Cross-Country) Dispersion of AI Publication Shares Figure 9(b) (Right) β-Convergence (Initial Share vs. Subsequent Growth Rate, 2000-2025)
Figure 10 presents the Chow test structural break detection results for five countries across the 2000-2025 period. Three countries share a common structural break year of 2012: China (F=29.5, p<0.001), EU27 (F=28.8, p<0.001), and India (F=11.4, p<0.001). The US and Japan share a different common break year of 2006, each with statistically significant Chow statistics (F=25.7, p<0.001 and F=8.8, p<0.01 respectively). The convergence of break years across China, EU27 and India at 2012 shows a system-level transition point, aligning with the time period of deep learning breakthrough and the intensification of China’s national AI investment strategy. The 2012 break precedes the most notable phase of China’s AI publication surge, suggesting that the structural transition identified in Figure 10 is the beginning of the current period of its concentrated dominance. The earlier 2006 break for the US and Japan similarly reflects a system-level transition, indicating the point at which both countries’ declining trajectory became a continual long-term trend instead of any temporary fluctuation.
Figure 10: Structural Break Detection in AI Publication Share Trajectories (Chow Test, 2000-2025)
Figure 11 presents the quality-quantity analysis of AI publication shares in 2025 along with citation impact trajectories across the study period. Figure 11a shows that China is the only country positioned clearly above the quantity-equals-quality diagonal, with its share of high-impact publications (approximately 48%) substantially exceeding its share of all publications (approximately 38%). These findings indicate that China’s research output is disproportionately concentrated in high-impact work relative to its volume. The US and EU27 both sit very close to the diagonal, suggesting that their quality and quantity shares are roughly equivalent at approximately 13% to 14% each. Figure 11b demonstrates that the US maintained the highest citation impact per paper throughout the study period, but its high-impact advantage has declined rapidly, from approximately 70 citations per paper in 2000 to approximately 15 by 2025. Alternatively, China’s citation impact per paper has grown steadily to approximately 38 by 2025. This means China has surpassed the US on citation impact per paper since around 2018-2019. Figure 11 challenges the general assumption that Western powers retain dominance in high-impact AI scholarship. China’s dominance is no longer confined to publication volume but extends to research quality and citation impact.
Figure 11 Publication Volume, Research Quality, and Citation Impact of AI Research (2025)
Figure 12 presents the Granger causality analysis of AI publication share dynamics across China, the US, EU27 and India. Out of all pairwise relationships tested in Figure 12(a), only two are statistically significant: US and China (p = 0.017) and EU27 and US (p = 0.039). Past values of the US publication share improve the prediction of China’s subsequent trajectory beyond what China’s own historical values predict alone. Likewise, past values of EU27 publication share improve the prediction of US’s subsequent trajectory beyond what US’s own historical values predict alone. I do not find any statistically significant predictive relationships among the remaining pairs. The empirical findings suggest that Western publication share trajectories carry statistically significant predictive power for subsequent Asian trajectories, whilst the reverse relationship is not supported by my data. It is noteworthy that Granger causality tests for statistical association and temporal precedence but not causation.
Figure 12:
Granger Causality Analysis of AI Publication Share Dynamics
Discussion
The empirical findings of this study reveal a profound restructuring of the global AI research landscape between 2000 and 2025. By using the metric of percentage of global AI publications by country, this research helps map the relative dominance trajectories of major global players. The data demonstrates a paradigm shift, characterised by the systemic, decades-long decline of the historic Western powerhouses (the US and the EU27) and the extraordinary, centrally-driven ascent of China.
The Decline of Western Dominance
The empirical findings for the US and the EU27 illustrate a clear decline of their collective global dominance in AI publications. In 2000, these two entities commanded a combined share of global AI publications exceeding 57% (27.56% for the US and 29.53% for the EU27). By 2025, their combined share has plummeted to approximately 24.41%. There are two thematic observations that can be made.
First, the US, while initially maintaining a high global share of AI publications, has seen its relative share reduced by more than half, falling to 12.01% in 2025. This decline, particularly noticeable during China’s mid-2000s and post-2020 surge periods (Figure 7 & Table 7), suggests that while the US research base remains highly influential (as examined in Figure 11b), its capacity to grow its share of the volume of foundational AI research is diminishing relative to global growth, particularly in Asia, led by China and India.
Second, the EU27 exhibits an even steeper and more consistent decline, dropping from nearly 30% to 12.40% over the period (Figure 1 & Table 1). This is exacerbated by the prominent decline of key individual member states like Germany and France, and the UK’s post-Brexit independent trajectory further diluting the collective European share. This European fragmentation of AI research output, even when combined, fails to provide a cohesive counterweight to the centralised national strategies of other regions, such as East Asia.
The Ascendancy of China and Asia, and Its Implications
The metric I use in this study indicates relative dominance. This does not mean the actual volumes of AI publications from the US and the EU27 have been declining. Instead, the empirical findings show the fall in global dominance from Western powers is associated with the ascendancy of Asian powers, led by China, in AI publications. The most notable findings are the dramatic, policy-driven shift in China’s trajectory in AI publications (Choi and Yoon, 2025). Sitting at a modest 4.90% in global share in 2000, China surpassed both the US and the EU27 in global AI publication share by the mid-2000s and has since solidified its position as the undisputed dominant single global player, reaching nearly 36% of the global total by 2025. First, China’s rapid and sustained growth, marked by significant positive YOY percentage changes (Figure 7 & Table 7), highlights the efficacy of centralised strategic investment in academic output (Podda, 2025). This dominance in publication volume suggests that a disproportionate share of the world’s new, foundational AI knowledge is originating from Chinese institutions (Ellis, 2025).
Second, the empirical findings indicate that there is a new global balance. Figure 6 and Table 6 demonstrate this shift: in 2025, China’s 35.91% share is close to the combined share of 45.64% from all other major global players (the US, EU27, the UK, Canada, Japan, Korea, Singapore, and India). This near parity between China and the rest of the global powers has profound geopolitical implications. The control over the production of foundational AI knowledge translates into strategic advantages in setting technical standards, developing proprietary technologies, and securing future economic competitiveness (Quimba & Barral, 2024).
Third, while today’s global focus remains on the US-China dynamics (Figure 4 & Table 4), the significant growth of India, whose share has grown from 1.13% to nearly 10% by 2025, signals the rise of a diversified, multipolar Asian research ecosystem. I can see that the combined share of AI publications by non-China Asian powers (India, Japan, Korea and Singapore) (Figure 2 & Table 2) has already exceeded that of the EU27 and the UK combined (Figure 1 & Table 1) in recent years. This indicates that the decline in Western dominance is not solely attributable to China but reflects a broader, fundamental shift of research gravity towards Asia.
Structural Concentration and Polarisation of Global AI Research
In addition to the geographical redistribution documented in Figure 1-7, the HHI (Figure 8) and convergence (Figure 9) analyses demonstrate a structural dimension of the global AI publication landscape that is not displayed when studying volume trajectories alone. The HHI analysis shows that global AI publication output has become progressively more concentrated since 2013, with a statistically significant upward trend confirmed by the Mann–Kendall test (τ=0.667, p=0.002). The convergence analysis reinforces this finding; the standard deviation of publication shares across countries has widened since 2013, and the β-convergence regression has no statistically significant evidence to suggest lower-share countries are closing the gap with dominant players. These findings indicate that the global AI publication is polarising structurally, where the already-dominant players are enjoying more advantages over time. Such findings carry policy implications. If the gap between dominant and non-dominant players continues to widen at the current rate, the likelihood of a more balanced distribution of global AI research output diminishes over time. For Western policymakers, their challenge is not just the need to reverse relative decline in publication share, but to address specific structural conditions, such as research funding fragmentation in the EU and the migration of high-impact researchers from academic to industry in the US.
China’s Dominance from Publication Volume to Research Quality
The quality-quantity analysis presented in Figure 11 represents the most insightful finding of this study, which helps reframe the narrative of Western decline in AI scientific output. The general assumption in academic and policy discourse has been that Western countries, especially the US, dominate high-impact AI scholarship, despite China leading in publication volume. However, Figure 11(a) challenges this general assumption. The figure shows that China is the only country whose share of high-impact publications substantially exceeds its share of all publications in 2025. Figure 11(b) further indicates that China’s average citations per paper has grown steadily from 2000 to 2025, and has surpassed that of the US since 2018-2019. The US citation impact per paper has declined rapidly from approximately 70 citations per paper in 2000 to approximately 15 by 2025. The findings indicate that China’s dominance is demonstrated in both its publication volume and high-impact work. The migration of high-impact researchers from Western academic institutions to private industry documented by Jurowetzki et al. (2021) and Bianchini et al. (2025), along with the fragmentation of EU research investment argued by Balland et al. (2025), plausibly explains why Western citation impact has declined while China’s has risen.
The Granger causality analysis presented in Figure 12 offers a further perspective to the understanding of the structural interpretation of global AI publication dynamics. The findings that past values of the US publication share improve the prediction of China’s subsequent trajectory, and that past values of EU27’s share improve the prediction of the US trajectory, are insightful. A plausible interpretation of these findings is that Western early dominance in publication activity has motivated Asian research system to subsequently respond. As Western institutions established research directions and publication norms, Asian systems, especially China’s, were encouraged to boost the publication outputs subsequently. Another interpretation is that research priorities and methodological frameworks developed in Western academic contexts were subsequently adopted and scaled by Asian institutions. These possible interpretations remain speculative, as the Granger causality test (demonstrated in Figure 12) establishes that the statistical association but not causal relationship exists. These findings suggest that the relationship between Western and Asian AI publication trajectories, from 2000 to 2025, may not be on a competitive basis, but may show a certain degree of historical interdependence.
Conclusions
This study set out to examine and comparatively analyse the trajectories of global countries dominating AI publications between 2000 and 2025. By utilising the percentage of global AI publications by country as the core metric, the research effectively quantified the dramatic transition of the global AI research landscape. My analysis results in five core conclusions:
The primary conclusion is the decisive ascendancy of China, which increased its share of global AI publications from less than 5% in 2000 to nearly 36% by 2025. This makes China the single most dominant contributor to global AI research volume, significantly outpacing any other major country or bloc.
In contrast, the study confirms a sustained, systemic decline in the relative dominance of the historic, established AI players, namely the US and the EU27. Both have seen their individual shares reduced by over half, indicating that their output growth has failed to keep pace with the exponential global expansion of AI research, largely driven by Asian economies.
The research indicates a broader geographical shift of the AI research frontier towards Asia, evidenced by the substantial growth of India’s contribution alongside China’s dominance. This suggests that the current global AI race is increasingly a multipolar competition rooted in Asian research ecosystems.
The shift in publication dominance serves as a leading indicator of strategic capability. The concentration of foundational AI knowledge production in a single country (China) disrupts the geopolitical balance, urging the necessary strategic re-evaluation of AI-related research funding and collaboration policies across Western powers and the EU bloc to ensure technological resilience and competitive advantage. Furthermore, the Granger causality analysis outputs indicate a degree of historical interdependence between Western and Asian AI research systems which policymakers should take into account when designing international research collaboration frameworks.
China’s dominance in global AI research is no longer confined to publication volume. The quality-quantity analysis demonstrates that China’s share of high-impact publication exceeds its share of overall publications in 2025, and its average citations per paper has surpassed the US. These empirical outputs indicate China’s comprehensive research leadership that challenges the general assumption where Western countries retain dominance in high-impact AI scholarship.
This study has several limitations that should be acknowledged. First, the classification of AI publications relies on field-of-study tagging that follows the OECD standards. Papers in adjacent fields such as natural language processing or computer vision are only included if they are concurrently classified under core AI or machine learning categories. This means the datasets I used likely undercount the full breadth of AI-relevant scholarship. Second, whilst the Granger causality analysis identifies statistically significant predictive relationships between Western and Asian publication trajectories, it does not explain why past values of one country’s publication share predict another’s. Third, publication figures for 2025 should be interpreted with the acknowledgement that the datasets I used may not fully cover publications from late 2025 due to indexing delays. Therefore, the 2025 data should be seen as provisional but not complete.
Abbonato, D., Bianchini, S., Gargiulo, F., & Venturini, T. (2024). Interdisciplinary Research in Artificial Intelligence: Lessons from COVID-19. Quantitative Science Studies, 5(4), 922-35. https://doi.org/10.1162/qss_a_00329.
Aldasoro, I., Gambacorta, L., Korinek, A., Shreeti, V., & Stein, M. (2024). Intelligent Financial System: How AI Is Transforming Finance. BIS Working Papers No. 1194. Monetary and Economic Department of the Bank for International Settlements.
Balland, P., Di Girolamo, V., Benoit, F., Ravet, J., & Hobza, A. (2025). Divided We Fall Behind: Why a Fragmented EU Cannot Compete in Complex Technologies. Publications Office of the European Union. https://doi.org/10.2777/8548441.
Bruce, A., Timmerman, L., Fiakpui, N., Lessey, L., Beardah, M., Daeid, N., & Menard, H. (2025). A Scientometric Review of Explosives Research: Challenges and Opportunities. Forensic Science International, 373: 112513. https://doi.org/10.1016/j.forsciint.2025.112513.
Carlo, A. (2021). Artificial Intelligence in the Defence Sector. In Mazal, J., Fagiolini, A., Vasik, P., & Turi, M. (Eds.), Modelling and Simulation for Autonomous Systems. Modelling and Simulation for Autonomous Systems (MESAS) 2020. Lecture Notes in Computer Science, 12619. https://doi.org/10.1007/978-3-030-70740-8_17.
Carchiolo, V., & Malgeri, M. (2024). Navigating the AI timeline: From 1995 to today. In Proceedings of the 13th International Conference on Data Science, Technology and Applications (DATA 2024) (pp. 577–84). SciTePress. https://doi.org/10.5220/0012856700003756.
Choi, C. & Yoon, J. (2025). AI Policy in Action: The Chinese Experience in Global Perspective. Journal of Policy Studies, 40(2): 1-23. https://doi.org/10.52372/jps.e685 (Accessed September 20, 2025).
Färber, M., & Tampakis, L. (2024). Analysing the Impact of Companies on AI Research Based on Publications. Scientometrics, 129, 31–63. https://doi.org/10.1007/s11192-023-04867-3.
Gao, X., Wu, Q., Liu, Y., & Yang, R. (2024). Pasteur’s Quadrant in AI: Do Patent-Cited Papers Have Higher Scientific Impact? Scientometrics, 129(2), 909–32. https://doi.org/10.1007/s11192-023-04925-w.
Gerlich, M. (2024). Brace for Impact: Facing the AI Revolution and Geopolitical Shifts in a Future Societal Scenario for 2025–2040. Societies, 14(9): 180. https://doi.org/10.3390/soc14090180.
Gohil, M. (2023). A Study on the Impact of Artificial Intelligence (AI), Automation and the Digital Transformation on Society, 3(4). Revista Review Index Journal of Multidisciplinary, 3(4), 22-27. https://doi.org/10.31305/rrijm2023.v03.n04.004.
Hamilton-Hart, N. & Yeung, H. (2021). Institutional Under Pressure: East Asian States, Global Markets and National Firms. Review of International Political Economy, 28(1), 11-35. https://doi.org/10.1080/09692290.2019.1702571.
Hong, S. Zhong, D., & Um, K. (2025). The Impact of Artificial Intelligence (AI) Adoption on Operational Performance in Manufacturing. Journal of Manufacturing Technology Management, 1-23. https://doi.org/10.1108/JMTM-03-2025-0227.
Hood, W. W., & Wilson, C. S. (2001). The Literature of Bibliometrics, Scientometrics, and Informetrics. Scientometrics, 52, 291–314. https://doi.org/10.1023/A:1017919924342.
Jurowetzki, R., Hain, D., Mateos-Garcia, J., & Stathoulopoulos, K. (2021). The Privatisation of AI Research(-ers): Causes and Potential Consequences—From University-Industry Interaction to Public Research Brain-Drain? arXiv. https://arxiv.org/abs/2102.01648.
Jurowetzki, R., Hain, D., Wirtz, K., & Bianchini, S. (2025). The Private Sector is Hoarding AI Researchers: What Implications for Science? AI & Society, 40, 4145–52. https://doi.org/10.1007/s00146-024-02171-z.
Khan, M., Khan, H., Omer, M., Ullah, I., & Yasir, M. (2024). Impact of Artificial Intelligence on the Global Economy and Technology Advancements. In Hajjami, S., Kaushik, K., & Khan, I. (Eds.), Artificial General Intelligence (AGI) Security. Advanced Technologies and Societal Change. Springer. https://doi.org/10.1007/978-981-97-3222-7_7.
Liu, N., Shapira, P., & Yue, X. (2021). Tracking Developments in Artificial Intelligence Research: Constructing and Applying a New Search Strategy. Scientometrics, 126(4), 3153–92. https://doi.org/10.1007/s11192-021-03868-4.
Mahdi, S., Battineni, G., Khawaja, M., Allana, R., Siddiqui, M., & Agha, D. (2023). How Does Artificial Intelligence Impact Digital Healthcare Initiatives? A Review of AI Applications in Dental Healthcare. International Journal of Information Management Data Insights, 3(1): 100144. https://doi.org/10.1016/j.jjimei.2022.100144.
Mingers, J. & Leydesdorff, L. (2015). A Review of Theory and Practice in Scientometrics. European Journal of Operational Research, 246(1), 1-19. https://doi.org/10.1016/j.ejor.2015.04.002.
OECD.ai Observatory (n.d.). OpenAlex. Retrieved from https://oecd.ai/en/openalex (Accessed September 20, 2025).
Priem, J., Piwowar, H., & Orr, R. (2022). OpenAlex: A Fully-Open Index of Scholarly Works, Authors, Venues, Institutions, and Concepts. arXiv. https://doi.org/10.48550/arXiv.2205.01833.
Quimba, F. & Barral, M. (2024). ASEAN Centrality amid Increasing Global Multipolarity. PIDS Discussion Paper Series, No. 2024-38. Philippine Institute for Development Studies. https://doi.org/10.62986/dp2024.38 (Accessed September 20, 2025).
Sinha, A., Shen, Z., Song, Y., Ma, H., Eide, D., Hsu, B., & Wang, K. (2015). An Overview of Microsoft Academic Service (MAS) and Applications. In Proceedings of the 24th International Conference on World Wide Web (WWW ’15 Companion) (pp. 243–6). ACM. https://doi.org/10.1145/2740908.2742839.
Wang, K., Shen, Z., Huang, C., Wu, C., Eide, D., Dong, Y., Qian, J., Kanakia, A., Chen, A., & Rogahn, R. (2019). A Review of Microsoft Academic Services for Science of Science Studies. Frontiers in Big Data, 2: 45. https://doi.org/10.3389/fdata.2019.00045.
Generation Z (Gen Z) is widely considered the first cohort to come of age entirely in the epoch of generative artificial intelligence (AI). There is no universally agreed-upon definition of the age range for Gen Z. Australia’s McCrindle Research uses those born between 1995 and 2009 to address Gen Z; McKinsey & Company defines Gen Z as those born between 1996 and 2010; Pew Research Centre refers to Gen Z as those born between 1997 and 2012. While Gen Z are the most active adopters of generative AI, existing scholarship argues that adoption has outpaced institutional preparation and service delivery. An influx of press and social media articles and videos addressing how the labour market entry points Gen Z expected upon university graduation are vanishing, and their mental health, which was already deteriorated in the midst of the social media age, has compounded alongside an explosion in algorithmically mediated social life.
This analysis synthesises data-driven and peer-reviewed sources—large-scale surveys, payroll data, and experimental studies—to examine how Gen Z are experiencing the AI transition across three domains: (1) education, (2) social life and well-being, and (3) the labour market. The analysis is designed to allow for enriching the understanding among professional AI and social science researchers, as well as the general public.
In today’s landscape, we witness an unbalanced relationship between AI adoption and literacy. In the US, 79% of Gen Z have used AI tools, but only 28% of K-12 students attend schools with explicit AI policies. Students whose schools allow AI are 25 percentage points more likely to feel prepared to use it after graduation (57% vs. 32%). Such a gap is largest for students in low-income and rural communities.
Also, Gen Z well-being is deteriorating. Only 45% of Gen Z are thriving in 2025—reaching a three-year low, down from 49% in 2024. Among Gen Z women, the thriving rate fell from 46% to 37% between 2024 and 2025. Additionally, UK Gen Z report that social media negatively affects their self-esteem and discourages them from building healthy self-relationships.
In addition, we address the unemployment-induced anxiety, where the number of available entry-level job postings requiring 0-2 years of experience has been cut by 29 percentage points since January 2024. Researchers from the Stanford Digital Economy Lab, using Automatic Data Processing (ADP) payroll records covering millions of US workers, find a 16% relative employment decline for ages 22–25 in AI-exposed occupations, when comparing with their older counterparts.
Therefore, we witness cross-domain impacts on Gen Z induced by AI advancement. This analysis dissects the nuances in each domain with supporting data, so as to present how the behaviours and encounters of such a highly AI-adopted generation have changed, relative to their older counterparts.
1. AI in Education
1.1 AI Adoption Rates Across Generations
Like during the age of social media and digitalisation, today’s Gen Z has actively and willingly incorporated AI into both learning and non-educational activities. According to a Gallup survey (2025) commissioned by the Walton Family Foundation (WFF) (n = 3,465), we see that 79% of Gen Z in the US have used AI tools, and 47% do so at least on a weekly basis. In another report published by Pew Research Centre (2026) (n = 1,458; US teens aged 13 – 17), 57% of respondents have used chatbots to search for information, 54% to help with schoolwork and 47% for entertainment purposes. For these US teens, one in 10 now does all or most of their schoolwork with AI assistance. AI adoption has become widely popularised among Gen Z. For those adopting AI in educational settings, there are concerns about overreliance and subsequent barriers to independent and critical thinking development. For those who lack access to AI tools, such a circumstance deepens the ongoing sociological discourse on whether AI technology accelerates the entrenched digital inequality, partly inflicted by socio-economic factors.
SurveyMonkey disseminated the outputs of a study of 25,030 US adults in 2025. Their team carried out an AI sentiment study between October and December of 2024 among 25,030 US adults. The survey outputs were weighted to reflect the US demographic composition. They found that 61% of Gen Z use AI for education, relative to 53% of Gen X and 50% of millennials, who primarily use AI for workplace responsibilities. While the data support our argument that Gen Z is the quickest and most willing AI adopters, Gen X and millennials, especially those who are active in the labour market, are not far behind. Instead, half or more of US adults, across all three generations, have used AI for their educational or professional tasks.
Table 1 summarises the AI use rates by generation, with data extracted from major survey reports. While as many as 79% of Gen Z have ever used AI tools, only 47% reported that they use them on a weekly or daily basis. This tells that 32% of Gen Z have either tried using AI tools out of curiosity or decided not to highly adopt AI use in their tasks, so they are not frequent AI users. Another valuable insight is that 75% of Gen Z reported that they use AI to upskill, relative to 71%, 56% and 49% for millennials, Gen X and Boomers, respectively. Such figures inform that the majority of older generations (more than half of millennials and Gen X, and almost half of Boomers) are willing to use AI for upskilling. Such a trend indicates that the majority of the older generations are actively reskilling themselves to incorporate AI technology into their professional or everyday tasks, signalling that their skillsets should remain relevant in the labour market despite the rapid AI disruption.
Table 1: AI Use Rates by Generation — Key Figures from Major Surveys
While AI usage is high across generations, especially among Gen Z, it is necessary to understand whether there are available and sufficient institutional policies to support the young generation’s AI adoption in educational settings. The Gallup survey (2025) shows that only 28% of K-12 students in the US claimed that their schools explicitly allow the use of AI, and nearly half (i.e., 49%) reported that their schools have no policies on AI use or they are not sure of any presence of relevant policies. Among students whose schools have available AI policies, only about one-third (i.e. 36%) describe those policies as extremely clearly outlined.
Further data suggest how the AI readiness level affects students’ post-schooling outcomes. The Gallup survey (2025) indicates that students in schools with AI policies are 25 percentage points more likely to feel prepared to use AI after graduation (57% vs. 32%). Another recent study (2025) commissioned by Heartland Forward, Gallup and the WFF surveyed 1,474 Gen Z in 20 US heartland states. The study found that only 10% of K-12 students said their teachers have helped prepare them to use AI in future jobs, and as low as 9% of working Gen Z feel extremely prepared to use AI at work. Furthermore, schools in low-income areas are significantly less likely to have AI policies permitting its use. Such a report reveals the equity gap in AI-impacted K-12 education in the US.
Table 2: The Preparation Gap—AI Policy Presence and Student Readiness
1.3 Gen Z Students vs. Gen X/Y Teachers: Attitudes on the Use of AI
AI disruption is not restricted to the US or the West at large. Gen Z students in many high-income economies are affected by AI advancement in educational settings. Chan & Lee (2023) conducted a survey with 399 Gen Z students and 184 Gen X or Gen Y (meaning millennial) teachers at the University of Hong Kong on their experiences, perceptions and concerns about generative AI in higher education. Diagram 1 highlights the key findings in mean agreement scores that follow a five-point Likert scale on each statement. The value of one represents strongly disagree, and the value of five means strongly agree. All findings reported in Diagram 1 have p-values lower than 0.05. The data reveal an insightful generational divide. We can see that Gen Z respondents have higher mean scores than their Gen X/Y teachers on all positive statements about the use of AI, while the former have lower mean scores, relative to the latter, on all negative statements about using AI. The results show that Gen Z students are more optimistic, and enjoy more perceived benefits, from the use of AI than their teachers. Of course, the societal roles for both survey cohorts are different: one group represents the students in higher education, and the other belongs to their teachers. Perhaps Gen X/Y respondents share more concerns about the use of AI not because of generational factors but because of their societal role (as teachers/educators) in the higher education settings.
Diagram 1: Gen Z Students vs. Gen X/Y Teachers—Mean Agreement Scores on Key AI Attitudes (Chan & Lee, 2023)
Source: Chan & Lee (2023)—“The AI Generation Gap” (Smart Learning Environments, Springer / arXiv:2305.02878). n=399 Gen Z students, n=184 Gen X/Y teachers, University of Hong Kong. Mean scores on 5-point Likert scale (1=Strongly Disagree, 5=Strongly Agree). All items p <.05.
1.4 Academic Integrity
Another widely discussed issue in the intersection between AI and social science is whether and how AI disrupts academic integrity. Academic and research integrity have been the core foundation of ethics in educational settings. Given the extensive reporting on AI-induced hallucinations, for example, academic and research integrity might be significantly challenged without appropriate policy interventions. Table 3 summarises major recent studies on AI influence on academic integrity, including the key findings and the corresponding policy implications. In a report released by the publishing firm Wiley (Coffey, 2024), over 2,000 students and instructors were surveyed. Findings suggest that 47% of students say AI has made cheating easier, and 68% of instructors anticipate a negative impact from the use of AI on academic integrity. Comparatively, Lee et al. (2024) conducted a survey around November 2022 and found that high school cheating rates before and after the introduction of ChatGPT remained broadly stable. It is noteworthy that Lee et al.’s (2024) study focused on data collected around the time when ChatGPT was first publicly introduced. It is reasonable that high school students did not experience higher academic cheating rates upon the arrival of generative AI, because such an AI chatbot was not capable and functional enough to encourage academically dishonest behaviours. However, as indicated in the aforementioned report released by Wiley (Coffey, 2024), as AI tools have become far more capable over the years, cheating behaviours have been encouraged, and academic integrity has been at stake to a certain degree.
It is noteworthy that Bittle & El-Gayar (2025) carried out a systematic review of 41 studies and found that peer influence and personal ethics shape AI misuse more than institutional policies. Such an understanding reinforces the argument that heavy-handed AI bans may be less effective than co-shaping the development of AI literacy with honesty and values concentration between educators, scholars and policymakers.
Other than academic behaviours and integrity, Gen Z’s social media dynamics and personal well-being are worth discussing. First, this section, in addition to AI, includes the investigation of social media dynamics because nowadays social media is heavily AI-integrated, and both social media and AI are known as the most revolutionary digital technologies affecting the Gen Z population. Second, extensive studies address that mental health and well-being are a priority for Gen Z. Therefore, this section discusses the intersection between AI, social media and well-being among this generation.
Gen Z well-being, according to publicly available data, is declining. The aforementioned Gallup survey (2025) reveals that only 45% of Gen Z are thriving per Gallup’s Life Evaluation Index—which was the lowest between 2023 and 2025 of the study. Table 4 highlights the thriving rates of Gen Z. The largest decline can be seen among Gen Z women, whose thriving rates dropped from 46% in 2024 to 37% in 2025. Comparatively, Gen Z men’s thriving rates remain relatively stable (44% in 2024 vs. 45% in 2025). The survey further indicates that Gen Z adults are about 10 percentage points less likely to be thriving than older generations.
The Cybersmile Foundation carried out a national UK study examining the impact of social media use on Gen Z well-being. They surveyed 1,000 UK participants aged between 16 and 24. Their data suggest that social media has negative impacts on Gen Z. Diagram 2 extracts and highlights some key statistics indicating social media impact on Gen Z well-being. The findings, for example, show that 82% of respondents said social media negatively affected how they feel about their own bodies. 83% said content on social media made them feel pressured to be perfect. Also, 48% said their sleep had been negatively impacted by time spent online. There were, moreover, 38% who said social media made them want to permanently change a part of their body through surgery. Such a figure rose to 51% when we focus on female respondents. These survey outputs imply that social media causes Gen Z not to be able to develop healthy self-relationships, and their self-esteem and behavioural well-being are jeopardised.
Shehab et al. (2025) synthesise existing research and document that depression, anxiety and insomnia are among the most robustly evidenced harms for Gen Z inflicted by the addiction to Instagram and TikTok. In addition, the Gallup survey (2025) data shows that 41% of Gen Z have anxiety about AI specifically, compared to 36% who feel excited and 27% who feel hopeful. Additional data unveils that 49% of Gen Z believe AI will harm their critical thinking skills, which can lead to broader anxiety about dependency and cognitive overload in a way similar to how social media has affected this generation.
Diagram 2: Social Media Impact on Gen Z Well-being
As of writing this analysis, AI disruption in the labour market is notable and expanding. Mass unemployment, especially youth unemployment, has been widely reported internationally. In Randstad’s latest report, entitled “The Gen Z Workplace Blueprint: Future Focused, Fast Moving”, findings from job posting analysis of 11,250 global workers and 126 million job postings show that global postings for roles requiring 0-2 years of experience (meaning entry-level jobs) have fallen by an average of 29 percentage points since January 2024. The collapse of the entry-level job market is more salient in several positions, such as junior technology roles (down by 35%), logistics (down by 25%) and finance (down by 24%) (See Table 5).
Brynjolfsson et al. (2025) from the Stanford Digital Economy Lab analysed ADP payroll records covering millions of US workers. They found that early-career workers (aged 22 to 25) in AI-exposed occupations experienced 16% relative employment declines, controlling for firm-level shocks, while employment for experienced workers remained stable. The labour market adjustments occur primarily via employment rather than compensation, with employment changes concentrated in occupations where AI automates rather than augments labour (such as software development, customer service and clerical work).
Table 5: Entry-Level Job Posting Declines by Sector
3.2 Gen Z Career Strategy in Response to AI Disruption
From the same Randstad report, we can see that Gen Z is actively adapting to the AI-induced changes in the labour market by altering their career behaviours and decisions. Table 6 presents Gen Z’s career behaviours and decisions for AI adoption, relative to those from older generations. As discussed in Table 1, 75% of Gen Z use AI to learn new skills. In addition, from Table 6, 55%, 50% and 46% (up from 40% in 2024) use AI for professional problem-solving, use AI for job search and are worried about AI impact on their occupational opportunities, respectively. Their AI-induced career behavioural adjustments not only imply that they are active and willing AI adopters, but also reflect the circumstance that this generation is mostly impacted by AI disruption in the labour market due to the loss of entry-level jobs.
Table 6: AI Adoption in the Workplace—Gen Z Relative to Older Generations
Although media portrayals and general perceptions claim that Gen Z, unlike older generations, lack loyalty to an organisation due to laziness and low resilience, the Randstad report might suggest otherwise. Table 7 presents the job tenure and employment structure by generation. When comparing the first five years of career (instead of the current tenure), we can see that the average job tenure for Gen Z is 1.1 years, relative to 1.8 years for millennials, 2.8 years for Gen X and 2.9 years for Boomers. Here, we see the generational shift where early career job-taking patterns have constantly changed over the last few decades. There are almost half (45%) of Gen Z who are currently working full-time, and 52% are actively looking for a new role. While we cannot tell how many of those 52% who actively seek new roles already have a full-time position, at least the figures suggest that the majority of Gen Z choose to stay active in the labour market (either by finding jobs or already working full-time). Such figures dismiss the general perception that Gen Z are lazy to a certain degree. In fact, the change of the labour market structure, especially the AI disruption that causes the loss of entry-level jobs, may explain why staying active professionally nowadays seems far harder than that of previous generations. The data, moreover, shows that only 11% of Gen Z plan to stay in their current job long term. While this figure ostensibly shows that Gen Z has little loyalty to an organisation or workplace, in fact, the lack of available full-time entry-level positions might justify why many Gen Z members do not want to stay in their current job long term. This is because many might be working part-time or on a freelance and ad hoc basis. Therefore, staying in the current job does not offer any promising career path or financial security for Gen Z to display their loyalty at work.
Table 7: Job Tenure and Employment Structure by Generation
Source: Randstad (2025). Comparison figures reflect the same career stage (first 5 years), not current tenure.
4. Summary and Implications
We can see substantial behavioural changes between Gen Z and their older counterparts. This analysis finds that Gen Z is adapting to AI faster than institutional responses. Their well-being is constantly being jeopardised, caused by both the popularisation of AI and social media. Also, this generation is most vulnerable to AI-induced economic risks, since the labour market disruption mostly erases entry-level job opportunities.
In education, this analysis identifies a policy gap in institutional readiness, which lags AI adoption by a wide margin. Furthermore, the need for AI adoption in educational settings is compounding spatial and socio-economic inequalities. Regarding their well-being, this analysis shows that AI is disrupting rather than enriching Gen Z’s social and mental health. While there is research-based evidence identifying how (AI-integrated) social media are harming this generation, corresponding regulatory responses remain fragmented and not sufficiently effective. In the labour market, although Gen Z actively use AI for upskilling, they are the cohort whose job opportunities are technologically disrupted the most. There is a lack of policy responses on formal AI training access for the young generations, including Gen Z. Even if some jurisdictions may deliver policy responses on formalising AI training and upskilling opportunities for students, there remains an absence of any clear solution on how Gen Z, once sufficiently upskilled, can gain access to entry-level job opportunities.
Cite This
Hung, J. (2025). Gen Z and AI: Education, Well-Being and the Labour Market. AI in Society. https://aiinsocietyhub.com/articles/gen-z-and-ai-education-well-being-and-the-labour-market
Since November 2025, I have been building a periodically updated global panel dataset on artificial intelligence (AI). As a quantitative social and health data scientist and applied policy researcher who is transitioning into AI safety and AI societal impact research, I was disappointed by the fact that global panel data on AI are scattered.
Existing Data and Research Problems
Without centralised global panel data on AI, researchers and data scientists are discouraged from easily accessing comprehensive AI datasets for research. As currently constructed, different institutions publish their global AI data reports or datasets on their websites for public downloads, with some additional organisations presenting their internal AI data on interactive dashboards without allowing for public downloads. I know that I can do something about it—to make global panel data on AI more centralised, standardised, and curated and ready for public access and download.
The other issue I have realised since the beginning of 2025 is the lack of non-academic and non-paywalled publications that exclusively address AI in society. While some academic publications exclusively address AI in society, such as Oxford Intersections: AI in Society and AI & SOCIETY, we are unable to find non-paywalled equivalents outside academia. Therefore, since November 2025, I have decided to build my own site that exclusively presents non-academic and non-paywalled articles on AI societal impacts to both the professional AI safety research community and the general public.
The Global AI Dataset (GAID) Project
By the end of December 2025, I had very little clue about what addressing the above two data and research problems would lead my work to. All I was aware of was that once the above data and research gaps had been addressed, I should, sooner or later, have a clearer picture of how I should scale up my work. In December 2025, in the midst of software-engineering a web app that hosts non-academic and non-paywalled articles on AI societal impact and data-engineering my version 1 of a global panel dataset on AI, I decided to dub the entirety of my work the Global AI Dataset (GAID) Project. In this article, I would like to present what the GAID Project is about and how it has, as of writing this post, been designed as milestone-based. I am going to explain all milestones (or phases) of the GAID Project that I have already completed, as well as those that I am planning to develop and deliver in the coming months.
On Harvard Dataverse—a free, open-source, web-based repository, managed by the Institute for Quantitative Social Science (IQSS) at Harvard University—I describe the GAID Project (https://dataverse.harvard.edu/dataverse/gaidproject) as a comprehensive, longitudinal research repository designed to track the multi-dimensional evolution of AI across over 200 countries and territories. I explain that the GAID aims to bridge the data gap between fragmented raw data and high-integrity academic research, by unifying, centralising, curating, and standardising global panel data on AI to allow researchers, data scientists, and policy professionals to observe the global trajectory of the AI revolution.
While such a description on Harvard Dataverse outlines the main purpose of my work, the GAID Project, as currently planned, goes way beyond global panel AI data curation, compilation, and documentation. I would like to take the opportunity of writing this article to explain each of Phases 0–4 of my GAID Project, where I have already completed and delivered the outputs of Phases 0–2, and I have decided to spend the next months working on Phases 3–4.
Phase 0: Building a Web App, AI in Society
I engineered this web app, AI in Society (https://aiinsocietyhub.com/), in December 2025 for multiple reasons. One of the primary reasons, as indicated at the beginning of this article, is that I have learnt that there is a lack of non-academic and non-paywalled publications that exclusively address AI in society. To give some background about myself, I have 10 years of training (PhD, MSc, and BA) in quantitative sociology and social epidemiology. In addition to quantitative sociology and epidemiology, I have been trained in economics (especially in relation to the relationships between human capital and labour market participation), geopolitics (especially on China–Hong Kong and China–Southeast Asia relations), gender studies (with a specific focus on child sexual abuse, gender-based violence, gender inequalities, and women’s empowerment), human, international, and sustainable development (in alignment with the United Nations’ Sustainable Development Goals values), and public policy. In early 2025, when I was developing multiple original research papers on AI societal, economic, and geopolitical impacts (which are all published, as of writing this article), I realised two problems. The first problem was that, when searching for potential journal outlets for my work, there were only a handful of academic publications exclusively covering AI in society topics. As the influence of AI has been growing exponentially (I don’t have the data to back it up, but I reckon its influence has been growing at a much faster rate than that of social media and dot-coms decades ago), I believe there is an increasing need for non-academic researchers and the general public to gain access to data-driven, evidence-based, and narratively presented in-depth analysis on AI societal impacts.
The second problem was that I realised I had to inconveniently download datasets from multiple AI-focused databases, manually merge the datasets into one, and carry out econometric analysis for original research. Such a process was very time-consuming and human labour-intensive. In the AI era, the sexy terms are automation, efficiency, and productivity. The data analysis work for AI researchers and data scientists requiring heavy manual inputs, as of today, sounds user-unfriendly to some degree. Therefore, the initial design of the GAID Project was to address these two problems that I encountered.
Our world is at a stage, as of writing this article, where global AI players have been working on the societal and economic integration of AI technology. We have seen tech giants in the US, while chasing the continual boost of compute efficiency, emphasising more on how the ever-advancing AI technology can be translated into positive societal and economic returns over time. Alternatively, launched in 2024, China’s AI Plus (AI+) initiative has been strategically focusing on its 10-year plan to fully integrate its advanced AI technology across as many industries as possible. The awareness of the importance of optimising societal and economic impacts, instead of solely prioritising the continual boost of compute efficiency to achieve artificial general intelligence (abbrev., AGI), supports my decision to build a site that addresses AI societal impacts to the wider audience.
Therefore, when engineering my web app, AI in Society, I decided to add an Articles section that features non-academic and non-paywalled articles on AI societal impacts. Given my data science expertise, I expect most of the articles shared periodically would be data-driven. Yet, when applicable, some articles might be theoretically or methodologically focused, for example. In addition to building an Articles section, I decided to build a curated opportunities board section on my web app. In the early 2020s, when I was still a PhD student, I already spent the majority of my time browsing the Internet to search for both pre-doctoral and postdoctoral fellowships and funding opportunities. As we know, scientists spend the majority of their time on grant searching and writing rather than on actual research, so finding eligible funding opportunities that fit our expertise is a big deal for us. For AI funding opportunities, while some established sites, such as EA Opportunities Board, 80,000 Job Board, and AISafety.com, constantly feature new AI-focused fellowships and grants, many opportunities are being overlooked or unfeatured on these sites. Therefore, I engineered my curated AI Opportunities Board page to share AI fellowships and funding opportunities that I am aware of but may or may not be featured on these established sites.
The other, and more important, reason why I engineered my web app, AI in Society, is that I believe there is a need for me to establish my own site to host the deliverables of my GAID Project. As I mentioned, my GAID Project is milestone-based (which means it is ever-scaling). Therefore, rather than hosting my GAID Project deliverables across different online platforms, it is much easier for me to build my own site so that any future deliverables of the GAID Project can be directly featured on the centralised web app, AI in Society.
Phases 1–2: Compiling, Curating, and Documenting GAID Datasets
To further benefit the AI research community, between November and December 2025, I spent weeks data-engineering version 1 of the GAID dataset. As mentioned, it is very researcher-unfriendly to manually identify and download AI-focused datasets, followed by using any software package to merge them together and carrying out data cleaning and standardisation before analysis. I believe that as long as there can be a publicly-accessible global panel dataset covering AI across different domains, the time needed for researchers, data scientists, and policy teams to conduct AI research and evaluate AI impacts would be largely shortened. Therefore, in November 2025, I identified three arguably most comprehensive global AI databases, namely Stanford’s AI Index, OECD.ai (AI Policy Observatory), and the Global Index on Responsible AI, and intended to compile, clean, standardise, and document their public-access data as a new dataset for public use.
I finished engineering and published the version 1 GAID dataset (https://doi.org/10.7910/DVN/QYLYSA) in late December 2025 on Harvard Dataverse. The version 1 GAID dataset is a longitudinal panel dataset providing a comprehensive and harmonised overview of the global AI landscape currently available. This is a curated, compiled, and documented dataset that covers 214 unique countries and territories, from 1998 to 2025, across AI in eight domains, including economy, policy, and governance. I underwent a total of 123 steps of clinical cleaning and deduplication to optimise the data integrity of this version 1 dataset. This dataset can easily and immediately be ingested in R, Stata, Python, and SPSS, for example, for statistical data analysis. For my GAID datasets, including this version 1, I strategically only include country-level data, which means regional data (such as Europe, Asia, etc.) or city- or state-level data (such as California, New York) are excluded. Please note that I refer to country-level data to any place with an official three-letter International Organisation for Standardisation (ISO3) identifier that is assigned to countries, dependent territories, and special areas worldwide. For example, Hong Kong has its own country-level ISO identifier, which is independent of China’s counterpart. Therefore, data from Hong Kong are included in my GAID datasets.
In total, my version 1 dataset has over 24,000 unique metrics. The definitions of these unique metrics can be found in my codebook, which was published along with the version 1 GAID dataset at https://doi.org/10.7910/DVN/QYLYSA. For researchers, data scientists, and policy teams who would like to use my version 1 GAID dataset for AI research, please feel free to read the corresponding 186-page codebook that details how the unique metrics are measured and defined.
Publishing my web app, AI in Society, and the version 1 dataset marked the completion of Phase 0 and Phase 1 of my milestone-based GAID Project, respectively. From 26th December 2025, I spent roughly the next three weeks data-engineering, documenting, and publishing the version 2 dataset (https://doi.org/10.7910/DVN/PUMGYU) on Harvard Dataverse, which is Phase 2 of my GAID Project. The version 2 dataset is a significant expansion or upgrade of version 1 of the longitudinal panel dataset. I integrated, standardised, and surgically cleaned high-fidelity AI indicators from eight additional premier AI databases and websites into my existing version 1 dataset. These eight additional data sources for the version 2 dataset are: (1) MacroPolo Global AI Talent Tracker, (2) UNESCO Global AI Ethics and Governance Observatory, (3) IEA’s Energy and AI Observatory, (4) Epoch AI, (5) Tortoise Media – The Global AI Index, (6) WIPO (World Intellectual Property Organisation) – AI Patent Landscapes, (7) Coursera – Global Skills Report (AI & Digital Skills), and (8) World Bank – GovTech Maturity Index (GTMI).
Data collected from these eight additional sources was either by data ingestion or web-scraping, where applicable. Like version 1, the version 2 dataset is optimised for easy and immediate statistical data analysis on R, Stata, Python, and SPSS, for example. In this version 2 dataset, there are almost 26,000 unique metrics representing a total of 227 unique countries or territories (all with existing ISO3 codes) from 1998 to 2025 across 20 AI domains. Version 2 has almost 26,000 unique metrics, while version 1 has 24,000+ unique metrics; version 2 covers 227 unique countries and territories (all with specific ISO3 codes) and version 1 covers 214 unique countries/territories (all with specific ISO3 codes); and version 2 covers 20 AI domains, while version 1 covers eight AI domains. Therefore, version 2, overall speaking, is a far more comprehensive and in-depth global panel dataset on AI than version 1.
Version 2 was published in mid-January 2026 on Harvard Dataverse. Since version 2 is the most updated and comprehensive GAID dataset as of writing this article, I would recommend researchers, data scientists, and policy teams conducting AI research to use this version of the dataset for statistical data analysis. Also, please consult the accompanying 200-page codebook to understand how the unique metrics, across 20 domains, are measured and defined at https://doi.org/10.7910/DVN/PUMGYU when using the version 2 GAID dataset.
Phases 3–4: The Global AI Bias Audit—An Automated Evaluation and Interpretability Dashboard for Foundation Models and AI Agents
While building and finishing the version 2 GAID dataset, I have spent the past weeks designing the scale-up phases (i.e. Phases 3–4) of my GAID Project. I dub this scale-up project “The Global AI Bias Audit—An Automated Evaluation and Interpretability Dashboard for Foundation Models and AI Agents”. This scale-up project is designed to deliver the following two milestones:
Phase 3: Phase 3 involves engineering an interactive dashboard as a separate page hosted on my AI in Society web app, which interactively, dynamically, and programmatically shares national profiles and data visualisation of my version 2 GAID dataset.
Phase 4: Phase 4 involves stress-testing foundational AI models against my ground-truth GAID dataset for AI safety, fairness, and readiness, and to address digital colonisation in any AI-driven decision-making.
Description & Aims
This project aims to establish an automated AI Eval and interpretability dashboard built upon my GAID, 1998–2025, for which the wave 1, versions 1 and 2 were published on Harvard Dataverse, as discussed above. The dashboard will be hosted on my software-engineered web app, AI in Society. As of today, generative AI models lack a proactive validation mechanism to ensure their outputs are factually grounded and free from geographical bias. This project addresses such an interpretability gap by transforming the GAID into an automated benchmarking ecosystem for global AI researchers and policymakers. I built both my GAID dataset and my web app, AI in Society, via Python. I am updating the version 2 dataset to include composite AI indices (based on the GAID data) for global AI readiness, fairness, and safety. I will add code blocks to my Python scripts to design the interactive dashboard in a way that utilises the structure of GAID indices to programmatically audit foundation models, quantifying the discrepancy between model-generated assessments and my AI index scores.
This technical project has three objectives. The first objective is to develop a visual interpretability layer. I will refine my existing Python scripts to generate high-fidelity, interactive visualisations (e.g., geographical heatmaps and radar charts) of all 227 unique countries and territories across 20 GAID domains. Such an approach provides national profiles for all countries, serving as a visual ground truth against which large language models’ outputs can be compared. The second objective is to engineer an automated AI Eval pipeline. I will build a Python-based testing framework that programmatically evaluates the factual reliability of generative AI models via APIs. The engine will task generative AI models with estimating AI safety, fairness, and readiness for specific regions and will automatically calculate error metrics (e.g., mean absolute error) by comparing model responses to the GAID standards. The third objective is to quantify and explain geographical bias among generative AI models. I will launch the interactive dashboard that visualises model performance across different socioeconomic tiers, in order to see if the discrepancy between models’ assessments and the ground-truth GAID data and index scores increases among less developed countries compared to their wealthy counterparts. By utilising interpretability techniques, this project will, furthermore, identify specific domains (e.g., energy, talent, ethics) where models consistently fail to align with the ground-truth data, exposing the systemic hallucinations that compromise AI safety, fairness, and readiness in the Global South and non-Western democratic societies.
Goals
The project is strategically designed to advance our collective AI safety progress by making generative models more reliable, trustworthy, and customised for real-world governance. This project directly addresses the research priority of Responsible AI by transitioning my recently completed work on static data curation to the scale-up phase of automated AI Eval and interpretation. This project aims to satisfy three goals:
Achieving responsible AI and bias mitigation: I will build a bias audit infrastructure that uses longitudinal ground-truth data from my GAID dataset to quantify geographical hallucinations. Such work provides a rigorous technical framework to identify and mitigate systemic inaccuracies in how foundation models represent the Global South.
Designing innovative methodology by engineering a Python-based AI Eval pipeline: I will provide a scalable methodology for testing the factual reasoning of AI agents. Instead of building simplistic benchmarks, this project aims to deliver an evaluation-as-a-service platform, where model reliability is continuously verified against the high-scale, cross-domain, and yearly-updated GAID dataset.
Offering transparency and interpretability: The interactive dashboard utilises the 20 domains of GAID ground-truth data to explain why a generative AI model fails, locating specific knowledge gaps in areas such as energy infrastructure or ethical governance.
Timeline and Deliverables
The feasibility of this project is facilitated by my published foundational work: the GAID wave 1, versions 1 and 2 dataset and the software-engineered AI in Society web app. I resolved the primary technical hurdles—data acquisition and cleaning and the development of the Python scripts for the completed work. Such delivered outputs indicate that the implementation of this scale-up project is realistic and focused on engineering rather than data collection. Below are the three milestones I aim to reach for this project:
Coming months 1–4: Developing the Python-based visualisation backend to transform existing structured, clean data and corresponding composite AI index scores into interactive national profiles.
Coming months 5–8: Implementing the AI Eval engine, leveraging my expertise in Python and API integration to automate the stress-testing of foundation models (such as Gemini, GPT-5, Claude).
Coming months 9–12: Large-scale auditing and bias reporting on my interactive dashboard, as well as in a technical report paper (published at arXiv) and conference presentation (NeurIPS 2027 conference).
Note: A new wave of data from all data sources will be programmatically extracted at the end of each year for the GAID dataset, so the interactive dashboard enjoys metadata updates periodically to deliver living benchmarks.
Impact Assessment
The primary impact is the establishment of a global standard for auditing the reliability of generative AI across different domains (e.g., policy and governance). By providing the first automated tool, hosted as an interactive dashboard that quantifies geographical hallucination, this project enables developers, technologically enabled researchers, and policymakers to identify where models fail the Global South or non-Western democratic societies, preventing digital colonialism in AI-driven decision-making.
This project provides a positive scientific impact by introducing new benchmarks for interpretability through a statistically rigorous system with 20 domain quantification of model errors. This project also offers positive economic and policy impact. The interactive dashboard facilitates governments and industry professionals to verify the safety, fairness, and readiness of AI agents before deployment in global markets. This project supports, for example, the UK’s leadership in AI safety by providing a diagnostic tool that ensures AI-driven monitoring is factually accurate and geographically inclusive. My project optimises sustainability, as the automated pipeline with annually updated global panel GAID data ensures the tool remains relevant as AI strategies evolve. I will open-source the AI Eval Python scripts to foster a collaborative ecosystem where developers and researchers can contribute to a more equitable global AI landscape.
Collaborations across Disciplines and Sectors
This scale-up project is interdisciplinary, bridging computational data science, AI interpretability, and international political economy and governance. The project fosters a cross-sectional collaboration between academia and intergovernmental monitoring bodies. As the version 2 GAID dataset was developed by ingesting and web-scraping data feeds from 11 authoritative sources like OECD.ai, WIPO, and UNESCO, the project connects academic benchmarking with the practical needs of global governance organisations. The AI Eval engine is designed to be used by developers to stress-test their generative AI models for factual accuracy and bias. Not only will I publish a technical report paper to unveil the white-box details of the Python-based AI Eval pipeline, but I will also disseminate outputs to demonstrate how the GAID ground truth can improve model fine-tuning for global applications (through a technical paper on arXiv, a conference presentation at the NeurIPS 2027 conference, and public posts on the Effective Altruism Forum, LessWrong, and the AI Alignment Forum). Furthermore, I will aim at facilitating knowledge exchange by sharing outputs with the wider AI safety research community within and beyond academia. This ensures the technical insights gained from the Python-based AI Eval pipeline lead to better-informed regulations and more reliable AI tools globally.
Responsible AI
This project aligns with the core AI safety principle of responsible AI through the design and implementation of the Python-based AI Eval pipeline. This project is designed to mitigate systemic bias. The automated bias audit infrastructure will be presented in a leaderboard as part of the interactive dashboard, which quantifies geographical hallucinations and identifies precisely where foundation models fail to accurately represent the Global South and non-Western democratic societies.
Also, my project goes beyond traditional benchmarking. Based on my 20-domain global panel country-level GAID dataset, this project will establish a scalable methodology for testing the factual interpretability and reasoning fidelity of AI agents against high-scale, cross-domain evidence (meaning data from my GAID dataset). By delivering a rigorous, evidence-based diagnostic tool, this project ensures that we can develop generative AI that is not only high-performing but factually grounded and geographically equitable.
Equality, Diversity, and Inclusion
First, the primary objective of this project is to bridge the interpretability gap that leaves non-Western societies vulnerable to biased AI-driven decision-making. By setting an objective to quantify geographical hallucination, the research design includes the 227 unique countries and territories from the GAID dataset as equal subjects of study, rather than focusing on the high-resource AI ecosystems of the Global North alone. Such an approach ensures that the technical definitions of AI safety, fairness, and readiness are inclusive of, for example, diverse socioeconomic circumstances, energy constraints, and policy and ethical frameworks found across the Global South.
Second, the methodology of the AI Eval pipeline is built to detect and expose systemic bias. The methodology for stress-testing foundation models and AI agents includes a stratified analysis across different socioeconomic tiers. This ensures that the evaluation of reasoning fidelity is not biased toward countries with high data density. Also, by integrating 20 domains (e.g. talent, ethics, energy, policy, and governance), the methodology acknowledges that AI readiness is intersectional. This project audits whether a model’s bias in metrics from a single domain is compounded by a lack of understanding of factors from other domains in developing countries. Furthermore, to promote inclusion within the developer and technologically enabled researcher community, the Python scripts for the AI Eval pipeline will be open-sourced. Such an approach allows developers, researchers, and policymakers from low-resource institutions to utilise high-level interpretability tools that are often locked behind proprietary paywalls.
Third, my GAID dataset itself is an exercise in inclusive data gathering with global representation. Unlike many AI benchmarks that only cover OECD countries, GAID programmatically synthesises data for 227 unique countries and territories globally. By ingesting data from 11 diverse global AI databases and websites, such as UNESCO and WIPO, this project ensures that the ground truth is not derived from a single Western perspective but from a collection of international monitoring bodies. Moreover, the global panel nature of the country-level data (1998–2025) of my GAID dataset allows for an inclusive understanding of how AI safety, fairness, and readiness have evolved differently across various regions over time, preventing researchers, developers, and policymakers who use my GAID dataset or the expected outputs of this project (i.e. the interactive dashboard) from ignoring the progress of emerging economies.
Fourth, the reporting phase of this project is designed to be accessible and transparent to a global audience of stakeholders. The interactive dashboard will be hosted at my non-paywalled AI in Society web app with high-fidelity visualisations like geographical heatmaps. This project ensures that expected outputs are interpretable for researchers and policymakers who may not have a technical or computational data science background. I software-engineered my web app as an interactive and non-paywalled site. Its design avoids any static presentation and visualisation, and optimises reader-friendliness.
Also, the expected outputs will be disseminated across both highly visible technical academic platforms (such as NeurIPS and arXiv) and public-facing forums for AI safety research communities (such as Effective Altruism Forum, LessWrong, and AI Alignment Forum) by the end of the scale-up project. This multi-tiered reporting ensures that insights into geographical bias reach both the technically enabled researchers and developers of AI agents, as well as the policy-making community.
To supplement, the final reporting will rank model performance by country-income tier (i.e. high-income countries, upper-middle-income countries, lower-middle-income countries, and low-income countries). Such a design creates a public record of which AI agents are failing non-Western democratic societies. This design acts as a diagnostic and corrective measure, providing the evidence needed to advocate for more equitable AI development and deployment.
To Wrap Up
So far, I have self-invested and self-funded to complete and deliver the outputs of Phases 0–2 of the GAID Project. This week, I began to submit some funding applications to support the scale-up project (Phases 3–4) of my work. Like everyone else working on responsible AI, AI safety, AI alignment, and related fields, I don’t have a clear answer to how my ever-scaling work can benefit humanity upfront. I just started my work, reached a baby milestone, scaled my project up, and have repeated the same process until I gain a clearer picture and a more solid footing on how to contribute to building positive, constructive, and responsible AI.
Over the past few weeks, I have also thought about Phase 5 of my GAID Project. As of writing this article, Phase 5 is still at the concept stage. My concept is that Phase 5 will be building an AI for forecasting model based on my ground-truth GAID data and yearly updated GAID dataset(s), and will ideally be hosted on my AI in Society web app too. I will continue to consolidate my thought process and come up with a more concrete design of Phase 5 of my GAID Project, while working on Phases 3–4.
Cite This
Hung, J. (2025). The Global AI Dataset (GAID) Project: From Closing Research Gaps to Building Responsible and Trustworthy AI. AI in Society. https://aiinsocietyhub.com/articles/the-global-ai-dataset-gaid-project-from-closing-research-gaps-to-building-responsible-and-trustworthy-ai
In the thirty years of my life, I have experienced different phases of digital evolution. Born at the beginning of the dotcom bubble, our world has transitioned to social media popularisation, followed by the artificial intelligence (AI) hype, integration and advancement. Eleven years ago, when I began my undergraduate studies, I was recommended to, and ended up, studying quantitative social science, given how many UK professors acknowledged that purely qualitative and humanities scholars could hardly survive under the big data epoch. Fast forward to today, and the same could be said about AI: We either learn and practise it, or we are phased out.
With the latest available data, we can easily visualise a Venn Diagram. The population using the Internet reaches 6.04 billion worldwide (meaning 73.2% of the global population, according to Kepios). Within these 6.04 billion people, 5.66 billion (meaning 68.7% of the global population, according to Kepios) are social media users. Also, within the 6.04 billion people, 900 million actively use AI, accounting for some 11% of the global population.
AI-Driven High-Stakes Career Divergence
Our World in Data indicates that MySpace was the first social media to reach a million monthly active users—it achieved this milestone in 2004. Around that time, we witnessed the start of the social media era. If we take a look at Figure 1, we can see that social media popularisation experienced an exponential growth between 2004 and 2018. This gives us an insight into how the AI growth trajectory could look in another decade or longer. At least for now, it appears that the gap between the global population of active social media and AI users will be closing, as the former is saturated to a large degree while the latter is rapidly emerging.
Figure 1: Number of people using social media platforms, 2004 to 2018
Estimates correspond to monthly active users (MAUs), Facebook, for example, measures MAUs as users that have logged in during the past 30 days.
Source: Statista and TNW (2019)
Given its rapid growth and integration, recent Western commentary suggests that the labour market is already experiencing effects related to AI. In a recent US survey, 9.3% of domestic companies reported that they had used generative AI in production during the last two weeks. Such a figure offers an implication: in frontier AI economies like the US, while the AI hype is heightened, domestic companies’ AI adoption rate still has significant room for growth—and likely an exponential one if we learn from the historical records of the dotcom and social media patterns.
Goldman Sachs Research argues that, to date, the AI adoption of US companies remains very low. When contemporaneous technological adoption rates are low while such technology is expected to trend towards exponential growth in usage, the young labour force is positioned in a sweet spot for AI upskilling and professional adoption. Otherwise, they are at risk of facing occupational and economic downward mobility in the long run. Figure 2 tells us that the proportion of available AI jobs among all job postings grew modestly and constantly between 2014 and 2024 in major Western economies. Other than the US, other major Western economies had around 1% or less of the share of AI jobs among all job postings in 2024. Figure 2 further supports the argument that the young labour force is at a point of separation: Many could survive and thrive when climbing up the professional ladder, while others could be subject to downward mobility, depending on how determined and resilient they are in adopting and applying AI technology at work as AI demand rates in the labour markets continue to rise.
Figure 2: Share of AI jobs among all job postings
A job posting is considered an AI job if it requests one or more AI skills, e.g., “natural language processing”, “neural networks”, “machine learning”, or “robotics”.
Data source: Lightcast via AI Index Report (2025)
Point of Separation: Individual-Level Disparities
At such a point of separation, we can foresee a growth of individual-level and country-level disparities. I have spent 11 years conducting econometric modelling and analysis. Since I have transitioned into an AI safety researcher, I have, in addition, focused on AI modelling using machine learning techniques. Researchers know very well how the additions of parameters and subsequent ingestions of more data for training always lead to better and more predictive models. This means, with more parameters used in model training, AI models and agents are becoming increasingly powerful and capable, resulting in more productivity at work.
Figure 3 presents the exponential growth of parameters in notable AI systems (plotted on a logarithmic axis). We can see that the annual growth of parameters in notable AI systems advanced from 1.2 times per year, between 1950 and 2010, to 2.0 times per year, between 2010 and 2025. Statistically speaking, the exponential growth of parameters in notable AI systems has accelerated drastically since 2010. This means, AI models and agents have exponentially been more powerful and capable, especially in the post-2010 epoch. As the massive exponential growth of AI power and capability goes, those who are fully adopting and integrating AI technology at work would benefit from productivity, creativity, and intelligence boosts. On the contrary, those who are lagging in AI adoption are increasingly more likely to be phased out in the labour market as time goes on.
Figure 3: Exponential growth of parameters in notable AI systems
Parameters are variables in an AI system whose values are adjusted during training to establish how input data gets transformed into the desired outputs: for example, the connection weights in an artificial neural network
Daa source: Epoch AI (2025)
Point of Separation: Country-Level Disparities
Beyond individual-level discussion, country-level disparities are concerning too. Figure 4 shows the global usage index of Claude. The darker green the countries are, the more likely their populations (per capita) are to use Claude. We can see that countries with the highest per capita usage rate of Claude are major Western powers and other advanced frontier AI economies, led by Israel, Singapore, and Japan. It is noteworthy that in accordance with international sanctions and Anthropic’s commitment to supporting Ukraine’s territorial integrity, the Claude services are not available in areas under Russian occupation. Furthermore, the Claude services are not available in China.
As we can see from Figure 4, developing and emerging regions are far less likely to use Claude services, compared to their advanced and frontier AI counterparts. This indicates the imbalanced global distribution of Western AI services’ accessibility. Of course, Figure 4 alone does not necessarily suggest that developing and emerging economies’ populations are subject to AI technology-marginalisation and discrimination. One of the reasons is that, in the geoeconomic and geopolitical landscapes, Western resources are usually disproportionately shared among Western powers and a few other advanced economies, while the Chinese Government is targeting its global connections and influences in the developing regions. This means, even if Western AI services are disproportionately less likely to be used in the developing regions, these populations may, over time, be more likely to use the Chinese AI counterparts.
Figure 4: Global usage index of Claude
Data source: Anthropic Economic Index (2025)
In econometric analysis, I particularly specialise in panel data analysis looking at within-country and between-country nuances. Applying similar terminologies, we can see (1) between-country and (2) within-advanced-economy AI impacts on global disparities. Figure 5 informs how AI impacts our jobs. Employment opportunities that are high exposure and high complementarity to AI mean jobs that can and will be highly AI-integrated, which complement rather than threaten the human labour force. Employment opportunities that are high exposure but low complementarity to AI refer to jobs that can and will be highly AI-integrated, which threaten rather than complement the human labour force. Employment opportunities that are low exposure to AI, in addition, are jobs that are unlikely to be affected by AI advancement and popularisation. We see that most employment opportunities that are highly AI-integrated and complement rather than threaten the human labour force are concentrated among advanced economies. These employment opportunities are least likely to be available in low-income countries. Such between-country global economic inequalities may worsen as AI integration progresses in the labour markets.
Moreover, when looking at within-advanced-economy AI impacts, we see that advanced economies also share the most employment opportunities that are highly AI-integrated which threaten rather than complement the human labour force (Figure 5). In these advanced economies, a 2024 International Monetary Fund report states that lower-skilled labour forces are more likely to be threatened by AI integration in the labour markets than their high-skilled counterparts. Such a circumstance deepens existing economic inequalities between skilled and less-skilled labour forces in advanced economies. Given the fact that the speed of AI advancement continues to accelerate, such long-term AI-induced economic inequalities may plausibly worsen more than currently expected.
Figure 5: AI’s impact on jobs
Most jobs are exposed to AI in advanced economies, with smaller shares in emerging markets and low-income countries.
Data source: International Labour Organisation and International Monetary Fund (2024)
Policy Implications
AI is, and will continue to be, tightly tied to economic competitiveness at both the individual and country level, just like what the dotcom and social media historical records told us. Not only is AI adoption heading towards a diverged path, but the AI-induced gaps, as the above figures imply, are deepening. As of writing this piece, AI upskilling is, to a large extent, a personal choice. Media and commentary simply warn us that AI upskilling and adoption are going to be necessary for upward trajectories, professionally or nationally, and it is up to us—the mass population—to build our AI proficiency or not. Yet, for years to come, governments cannot simply launch AI schemes or opportunities for their young labour force to incentivise the voluntary building and application of their AI skillsets. Governments will have to mandatorily require educational institutions and corporate entities to design AI-focused education curricula and on-the-job training programmes, respectively. Moreover, if AI-induced economic inequalities continue to exacerbate, individual governments have to prepare the responsive social protection and labour protection policy adjustments, in order to provide a safety net for those who are negatively impacted by AI the most. Learning the use of social media or not a decade ago did not determine any individual or national productivity much. However, whether countries and their populations are AI-literate and even skilled or not could decide their long-term social standing.
Cite This
Hung, J. (2025). The Point of Separation: Data Suggests AI is Forcing a Global “Learn It or Be Phased Out” Career Divergence. AI in Society. https://aiinsocietyhub.com/articles/the-point-of-separation-data-suggests-ai-is-forcing-a-global-learn-it-or-be-phased-out-career-divergence
AI Opportunities Board
General Intelligence Fellow
Organization: The General Intelligence Company
Location: Global
Region: Remote
Type: Remote
Category: Fellowship
Posted: Mar 18, 2026
The General Intelligence Fellowship is a 30-day program where individuals receive $1,000 upfront and daily platform credits to launch a company using the Cofounder 2 agentic platform. Participants retain full ownership and IP of their business while helping test next-generation agent orchestration and infrastructure management systems.
Organization: Causality in Healthcare AI Hub (CHAI)
Location: United Kingdom
Region: UK
Type: On-site
Category: Funding
Posted: Mar 17, 2026
This funding opportunity supports academic researchers and post-doctoral research associates collaborating with industry partners and clinicians to advance causal AI research. Projects focus on aligning with the hub's mission to address healthcare challenges through AI innovation and interdisciplinary partnership.
Organization: Queens' College, University of Cambridge
Location: Cambridge, UK
Region: UK
Type: On-site
Category: Funding
Posted: Mar 17, 2026
This scholarship supports students pursuing an MPhil in Advanced Computer Science at the University of Cambridge. It provides full fee coverage for domestic students or a partial award of £25,000 for international students.
The AI and Society Fellowship is a fully-funded, three-month program supporting scholars in economics, law, and international relations to explore questions regarding AI power, wealth, and oversight. Fellows pursue autonomous research projects and engage with experts in the Bay Area to produce shareable academic outputs.
The Micsion Global Scholarship and Fellowship provides financial assistance to students, professionals, entrepreneurs, community organizers, and independent changemakers pursuing higher education opportunities worldwide. This program aims to support high-achieving individuals by covering tuition and educational expenses to foster academic excellence.
This three-month fellowship supports mid-career professionals in developing research and policy recommendations for the ethical adoption of AI across Africa. Fellows will analyze regional regulations and global standards to design inclusive AI policies and mitigate algorithmic bias.
FDA Artificial Intelligence and Machine Learning Fellow
Organization: U.S. Food and Drug Administration (FDA)
Location: White Oak, Maryland
Region: US/Canada
Type: On-site
Category: Fellowship
Posted: Mar 6, 2026
This fellowship program offers research and developmental opportunities within the Center for Devices and Radiological Health's Artificial Intelligence Regulatory Science Program. Participants will conduct regulatory science research to ensure the safety and effectiveness of AI/ML-enabled medical devices in healthcare applications like disease detection and diagnosis.
This eight-week program invites fellows to conduct research projects focused on reducing long-term suffering risks and advancing technical AI safety. Participants receive mentorship from experienced researchers and collaborate on empirical AI safety agendas such as understanding malicious traits in LLM personas.
This senior fellowship offers a high-impact opportunity to lead the integration of AI across health, medicine, and life sciences through strategic digital transformation initiatives. The role involves driving AI adoption in predictive diagnostics, mentoring junior colleagues, and securing research funding through collaborative partnerships.
This intensive seven-day residential programme aims to build research capacity in the fields of AI consciousness, AI welfare, and the societal implications of digital minds. Fellows receive expert mentorship, strategic project scoping support, and fully funded travel to participate in technical and philosophical workshops.
The AI for Good Impact Awards feature three categories (AI for People, AI for Planet and AI for Prosperity), honoring innovation and impact across various sectors.
This 3-6 month program supports full-time AI safety researchers by providing access to a research center and professional network. Fellows receive full funding for travel, housing, meals, and office space while continuing their technical or governance projects.
The AI4X Postdoctoral Fellowship supports outstanding early-career researchers who leverage Artificial Intelligence (AI) to accelerate breakthroughs across science, technology, engineering, and mathematics, including medicine (STEM).
Critical AI Policy Virtual Fellowship 2026 is an opportunity for humanities or social science researchers to understand, challenge and reshape current policies around generative AI by joining a virtual collective of researchers working on AI and society.
Turing AI Global Fellowships attract up to five exceptional researchers who are either established international leaders in AI or who can demonstrate outstanding potential to shape the future of AI research globally. They must relocate to the UK and undertake transformational AI research that strengthens the UK’s position as a global leader in AI.
Organization: Department of Engineering Science, Oxford
Location: Oxford, UK
Region: UK
Type: On-site
Category: Full-time
Posted: Feb 10, 2026
This is a full-time Postdoctoral Research Assistantship opportunity to join the Oxford Witt Lab for Trust in AI (OWL) in the Department of Engineering Science (Central Oxford), to conduct hands-on empirical research in multi-agent security and agentic AI security, focused on adversarial testing (red-teaming) and mitigation of hard-to-detect failure modes in interactive AI systems (e.g., covert communication, collusion, strategic behaviour).
The Alfred P. Sloan Foundation provides direct support to authors for the research and writing of books aimed at enhancing public understanding of science and technology, including artificial intelligence. Grants are typically awarded to individual authors or through host institutions like universities to simplify complex scientific subjects for a general audience.
This programme invites early-career researchers from Least Developed and Lower Middle-Income Countries to spend four to eight weeks at Imperial College London conducting high-impact research. Fellows will focus on accelerating innovation through AI in Science and Open Hardware for Lab Automation to foster new global collaborations.
This opportunity provides funding for cutting-edge metascience research focused on optimizing R&D processes, research institutions, and the impact of AI. Projects must be based at a UK research organization, though collaborative efforts with international partners are strongly encouraged.
The Oskar Morgenstern Fellowship is a one-year online program for scholars and graduate students interested in political economy and emerging technologies like artificial intelligence. Participants engage in seminar-style colloquia to explore how different schools of political economy address institutional governance and the philosophy of science.
Organization: Institute for AI Policy and Strategy
Location: Washington, D.C. or Remote
Region: US/Canada, Remote
Type: Hybrid
Category: Fellowship
Posted: Jan 15, 2026
The IAPS AI Policy Fellowship is a three-month program designed for professionals to strengthen practical skills for securing a positive future with powerful AI. Fellows conduct independent research projects, such as writing policy memos and briefing officials, while receiving mentorship and financial support.
The Artificial Intelligence Journal provides substantial funds to support the promotion and dissemination of AI research through competitive open calls and sponsorships. Approximately 160,000 USD is allocated annually to support activities such as studentships and specialized AI research initiatives.
Carr-Ryan Center’s Technology and Human Rights Fellow
Organization: Harvard Kennedy School Carr-Ryan Center for Human Rights
Location: Global
Region: Remote
Type: Remote
Category: Fellowship
Posted: Jan 3, 2026
This program focuses on exploring how technological developments impact human rights protections, specifically addressing challenges related to surveillance capitalism. Fellows participate in a multi-year effort to investigate the intersection of democracy and technology through research and academic collaboration.
The 2026 Mozilla Fellows program supports visionary leaders including technologists, researchers, and creators building a better tech future. Fellows receive financial backing, professional development, and access to a global network to lead impactful projects and share expertise.
Organization: Centre for the Governance of AI (GovAI)
Location: London, UK
Region: UK
Type: On-site
Category: Fellowship
Posted: Dec 24, 2025
This three-month fellowship is designed to launch or accelerate impactful careers in AI governance and policy through independent research projects. Participants receive mentorship from leading experts, engage in expert seminars, and develop research outputs such as white papers or policy analysis.
Organization: MATS (ML Alignment & Theory Scholars)
Location: Berkeley, CA
Region: US/Canada
Type: On-site
Category: Fellowship
Posted: Dec 20, 2025
The MATS Program is a 12-week independent research fellowship that connects emerging researchers with top mentors in AI alignment, interpretability, governance, and security. Fellows conduct intensive research while participating in workshops, talks, and networking events to advance safe and reliable AI.
The Teaching Assistant supports the TARA educational program by assisting in the delivery of curriculum and student engagement. The role involves working closely with lead instructors to facilitate a productive learning environment for all participants.
SPAR is a part-time research program that pairs aspiring AI safety and policy researchers with expert mentors to address risks from AI. Mentees work on impactful research projects for three months, culminating in a Demo Day and career fair with leading safety organizations.
SaferAI is seeking a Research Scientist to lead the development of CBRN risk models and monitoring systems for a European Commission tender. The role involves conducting technical research at the intersection of biosecurity and AI safety to inform regulatory enforcement for general-purpose AI systems.
This program provides fast grants of up to $10,000 to support AI research and development that improves decision-making, allocation, and impact assessment in public goods. Selected projects aim to develop AI-powered tools such as grant allocation algorithms and predictive analytics while undergoing peer review through journal publication.
This initiative provides financial grants, office space, and dedicated compute resources to researchers and builders using AI to advance science and safety. The program aims to create a decentralized ecosystem that supports open and secure AI-driven progress across security, biotechnology, and nanotechnology.
The COMPASS research group is hiring researchers across all levels to focus on safe, aligned, and steerable AI agents. Research areas include AI security, multi-agent dynamics, and mitigating risks like prompt injection and deceptive alignment.
The Accelerator Fellowship Programme is a global AI ethics hub dedicated to tackling the toughest ethical challenges posed by artificial intelligence. It brings together leading thinkers and experts to collaborate on impactful contributions to AI regulation, industry practices, and public awareness.
This fellowship offers early-career scientists the opportunity to pursue independent research at the intersection of AI and science with full access to computational and laboratory resources. Fellows divide their time between San Francisco and academic partner institutions to accelerate high-impact scientific discoveries.
Organization: ARIA (Advanced Research and Invention Agency)
Location: United Kingdom
Region: UK
Type: Remote
Category: Funding
Posted: Dec 18, 2025
This opportunity provides seed funding for individuals or teams pursuing research focused on advanced monitoring and resilience-boosting interventions to prevent ecological collapse. High-potential proposals that align with or challenge core beliefs in ecosystem engineering can receive up to £500,000 to uncover new pathways for planetary prosperity.
This £46m programme seeks to create a new class of medicines called sustained innate immunoprophylactics to provide durable protection against respiratory viruses. ARIA is funding ambitious projects across synthetic biology, systems immunology, and AI to foster radical advances in viral resilience.
Organization: Advanced Research and Invention Agency (ARIA)
Location: United Kingdom
Region: UK
Type: Remote
Category: Funding
Posted: Dec 18, 2025
This £50m programme aims to develop low-cost, persistent, and autonomous atmospheric platforms capable of keeping a 20 kg payload aloft and powered for seven days. It seeks interdisciplinary proposals for novel architectures that can provide a scalable alternative to orbital satellites for high-performance connectivity.
Organization: ARIA (Advanced Research and Invention Agency)
Location: United Kingdom
Region: UK
Type: On-site
Category: Funding
Posted: Dec 18, 2025
This programme provides at least £55m to support the creation of a foundational toolkit for engineering the mitochondrial genome in vivo. It funds ambitious interdisciplinary projects focused on delivering, expressing, and maintaining nucleic acids within the mitochondrial matrix to enable new therapeutic interventions.
The AI Futures Fund is a collaborative initiative designed to accelerate AI innovation by providing startups with equity funding and early access to advanced Google DeepMind models. Participants receive technical expertise from Google researchers and Cloud credits to support the scaling of AI-powered products.
Organization: Apart Research and Heron AI Security
Location: London, Tel Aviv, and San Francisco
Region: US/Canada, UK, Remote, Others
Type: Hybrid
Category: Fellowship
Posted: Dec 18, 2025
A part-time research program where cybersecurity professionals collaborate with field leaders to secure transformative AI systems through concrete technical projects. Research teams work for four months to produce publishable results, open-source prototypes, or technical reports under expert guidance.
Organization: University of Toronto / Vector Institute
Location: Toronto, Canada
Region: US/Canada
Type: On-site
Category: Full-time
Posted: Dec 18, 2025
This role involves leading research on methodological and theoretical advances at the intersection of uncertainty quantification and reasoning in large language models. Successful candidates will have a PhD, strong programming skills, and a track record of publications at top machine learning venues like NeurIPS or ICML.
The Martian Interpretability Challenge offers a $1 million prize to advance the field of interpretability with a specific focus on code generation. This initiative aims to transform AI development from 'alchemy' into 'chemistry' by developing principled ways to understand and control how models function.
This eight-week incubator pairs fellows with expert mentors to execute projects aimed at improving the welfare of future sentient beings across various cause areas. Participants work at least five hours per week to deliver a finished output or a detailed funding proposal for long-term impact.
Location: San Francisco Bay Area and various newsroom locations
Region: US/Canada, UK, Others
Type: On-site
Category: Fellowship
Posted: Dec 18, 2025
The Tarbell Fellowship is a one-year program for journalists to cover artificial intelligence through nine-month newsroom placements and specialized training. Fellows receive stipends ranging from $60,000 to $110,000 alongside mentorship from expert reporters and a weeklong summit in the San Francisco Bay Area.
Research Assistant - Science and Emerging Technology
Organization: RAND Europe
Location: Cambridge, UK
Region: UK
Type: Hybrid
Category: Full-time
Posted: Dec 18, 2025
The Research Assistant will support policy-oriented research projects within the Science and Emerging Technology team at RAND Europe. This role involves conducting literature reviews, data analysis, and contributing to high-quality reports for various public and private sector clients.
This role involves advancing AI capabilities in secure coding and vulnerability remediation through reinforcement learning research and engineering. Candidates will design RL environments and conduct experiments to enhance defensive cybersecurity workflows within Anthropic's Horizons team.
The Visiting Fellows program brings together professionals from diverse sectors to join Constellation's Berkeley-based workspace for three to six months to advance their research. Fellows receive comprehensive support including travel reimbursement, housing, meals, and 24/7 access to a collaborative environment with leading AI researchers.
This role involves leading the development of UK legislative and regulatory positions while engaging with government and parliamentary stakeholders to advance AI safety. The advisor will translate technical research into policy recommendations and collaborate with global legal and technical teams to shape Anthropic's strategic outlook.
Location: London, UK; Ontario, CA; San Francisco, CA; Berkeley, CA
Region: US/Canada, UK, Remote
Type: Hybrid
Category: Fellowship
Posted: Dec 18, 2025
The Anthropic Fellows Program is a four-month initiative designed to accelerate AI safety research by providing funding, mentorship, and stipends to technical talent. Fellows work on empirical projects aligned with research priorities such as scalable oversight and mechanistic interpretability, aiming to produce public research papers.
Location: San Francisco, Berkeley, London, Ontario, or Remote
Region: US/Canada, UK, Remote
Type: Hybrid
Category: Fellowship
Posted: Dec 18, 2025
The Anthropic Fellows Program provides funding, mentorship, and compute resources for technical talent to conduct empirical research on AI security and safety for four months. Fellows work with Anthropic researchers to produce public outputs, such as papers, focusing on defensive AI use and securing infrastructure.
Organization: Centre for the Governance of AI (GovAI)
Location: Oxford, United Kingdom
Region: UK
Type: On-site
Category: Fellowship
Posted: Dec 18, 2025
This three-month program is designed to launch or accelerate impactful careers in AI governance through independent research and expert mentorship. Fellows conduct projects of their choice while participating in professional development seminars and networking with practitioners across government and industry.
Organization: Centre for the Governance of AI (GovAI)
Location: Oxford, UK
Region: UK
Type: On-site
Category: Fellowship
Posted: Dec 18, 2025
The Summer Fellowship Applied Track is a three-month program designed to accelerate careers in AI governance through projects in fields like communications, policy, and operations. Fellows participate in expert seminars and receive mentorship to develop non-research skill sets for the AI safety ecosystem.
The AI Biosecurity Manager will drive consensus on threat models, evaluations, and mitigations for biological and chemical risks associated with frontier AI models. This role involves coordinating expert workshops, managing collaborative research projects, and documenting emerging industry practices for managing high-level biosecurity threats.